It feels like a lifetime ago, already, but I do vaguely remember that we released our Generator Statistical Digest 2019 last week, on Tuesday 28th January 2020.
All the tasks that I had scheduled to follow on from that launch have been pushed to the wayside as the NEM has delivered plenty of real-time challenges for those operating in the NEM in various ways – and so us in extension of that.
Since that time there’s been:
1) Thursday 30th January, when which extreme weather drive demand high in South Australia and Victoria – which combined to drive the NEM-wide demand to 34,527MW.
2) Friday 31st January delivered more extreme outcomes, because of:
(a) Extreme heat, coincident across VIC and NSW, driving the NEM-wide demand up close to the all-time maximum record, falling just shy at 35,169MW
(b) we also saw a range of other remarkable events outlined here – including wind speeds uprooting transmission towers and islanding South Australia from the eastern part of the NEM once more (on this occasion more severely, in some ways, due to lengthy repair processes).
3) On Saturday 1st February we had extreme heat driving NSW demand remarkably high, especially for a Saturday.
… so this is a summer that just keeps on giving, in terms of extreme challenges…
————————-
Today we saw another big day – though one without any of the fireworks, in terms of spot price volatility (at least to the point I am publishing this, at 18:00) – this time focused on the Queensland region of the NEM.
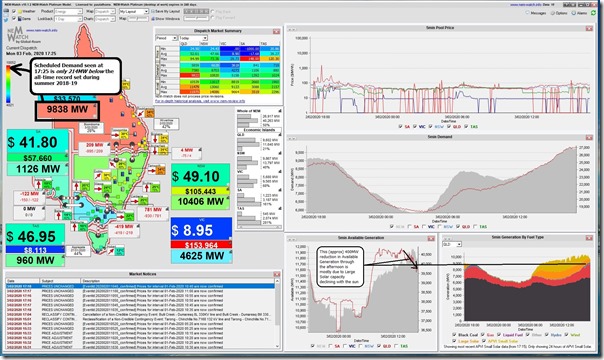
Here’s a snapshot from our NEMwatch v10 (entry-level dashboard) which illustrates the strength of the QLD demand – having risen to 9,838MW in this snapshot (from the 17:30 dispatch interval NEM time)
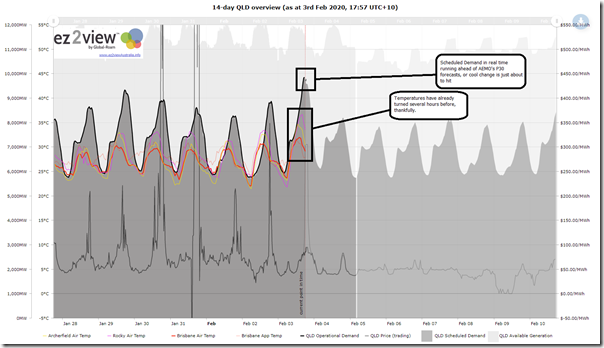
Here’s a current grab from this trend in ez2view online, which shows today’s Scheduled Demand in comparison to the prior week, and forecasts for the coming week:
Because temperatures have already started dropping, it seems less likely that we’ll see the ‘double hump’ in QLD demand shape we sometimes see when stubbornly high levels of heat translate to a second increase in scheduled demand as solar tails off, and home air-conditioning systems crank up.
This means that we’re looking at a peak demand today (9,838MW at 17:30) which is only 214MW below the all-time record set only a year ago (10,0052MW set at 16:55 on 13th February 2019). So close, but no record this time… perhaps in the next couple weeks?


Be the first to comment on "Heat pushes QLD Scheduled Demand within 214MW of the all-time maximum level on 3rd February 2020"