First things first – no, I am not predicting any particular outcome of the 2nd State of Origin Game tomorrow.
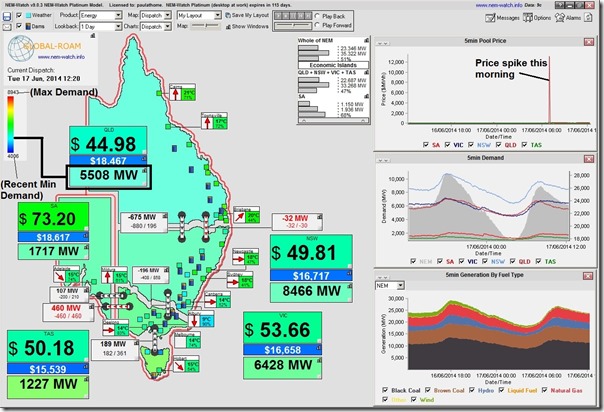
Rather, I’m just observing today that the NEM-Watch colour-coding applied to each region indicates that the Queensland demand seems particularly blue today. The colour of each region is set on a sliding scale between dark blue and red, depending on where the current demand rates compared to a historical range – hence we can see in the snapshot from 12:20 below that the QLD demand is relatively low compared with the (greener) demand in the southern regions:
At only 5,508MW (measured on a dispatch target basis) the demand is down the bottom of the historical range. Not dark blue, but noticeable given that this is the middle of the day, and the sun is shining brightly in Brisbane.
As with anything in the complexity of the energy market, there are a number of factors at work – with two of these being:
1) The warmer temperatures now, following a chilly morning (at least for Brisbane) mean that electricity usage for heating (or cooling) is minimised; and
2) With the sun shining brightly, all the solar that Mike talked about would be pumping into the grid, behind the meter – hence reducing the scheduled demand left over that the AEMO has to meet in dispatching the market.
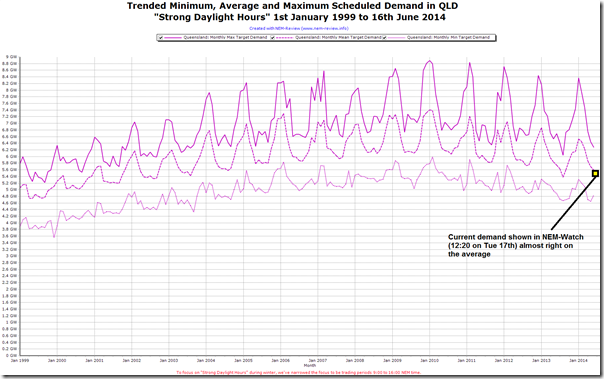
Powering up NEM-Review to trend back over time and limiting the time range of the analysis to only what I have defined as “strong daylight hours” during winter (9am to 4pm NEM time). This highlights to me that the current demand is actually pretty much in the middle of the range, with the minimum demand experienced so far this year being as low as 4,647MW (in this hour range):
Would make for a much darker blue in NEM-Watch!
One more reminder of the ongoing trend of declining demand, which the AEMO noted yesterday may not recover for some years….


Fascinating to cross-reference your post with the estimated contribution from solar (http://pv-map.apvi.org.au/), and the demand charts on AEMO’s website. In Queensland on the 17th solar contributed about 500 MW at midday, or about 50% of the solar installed capacity, and there was a strong slump in demand co-incident with the solar contribution. However in Victoria a cloudy day caused a maximum solar contribution of 15%, and there was little midday slump in power demand.