
Those following our WattClarity coverage this week would be aware that the NEM has experienced supply-demand tightness for the past three nights, with this trend set to continue into this evening.
As we’ve been tracking, NEM-wide IRPM (Instantaneous Reserve Plant Margin) has dropped below 15% during the evening peaks on Monday, Tuesday and Wednesday this week – which in short, means that there has been less than 15% available generation in excess of what has been dispatched to meet demand. Thus far, IRPM has hit a low of 10.89% which occured during the 18:25 dispatch interval on Tuesday evening. Apart from a couple of isolated price spikes in South Australia, this supply-demand tightness has thus far not eventuated into extreme pricing.
As we’ve noted, the main drivers for this tightness have been cold temperatures (increasing demand via heating), low evening wind speeds, and a number of offline coal units.
Below I’ll focus on the wind aspect, and share a couple of visuals that should help us understand the spread and extent of the wind lull over the three previous evenings.
—
We’ll start with a quick look at the pressure systems that have formed over eastern half of Australia. The screenshot below taken from Windy this afternoon shows a high-pressure system centered above an area east of Brisbane, and a low-pressure system formed above the southern coast of South Australia.
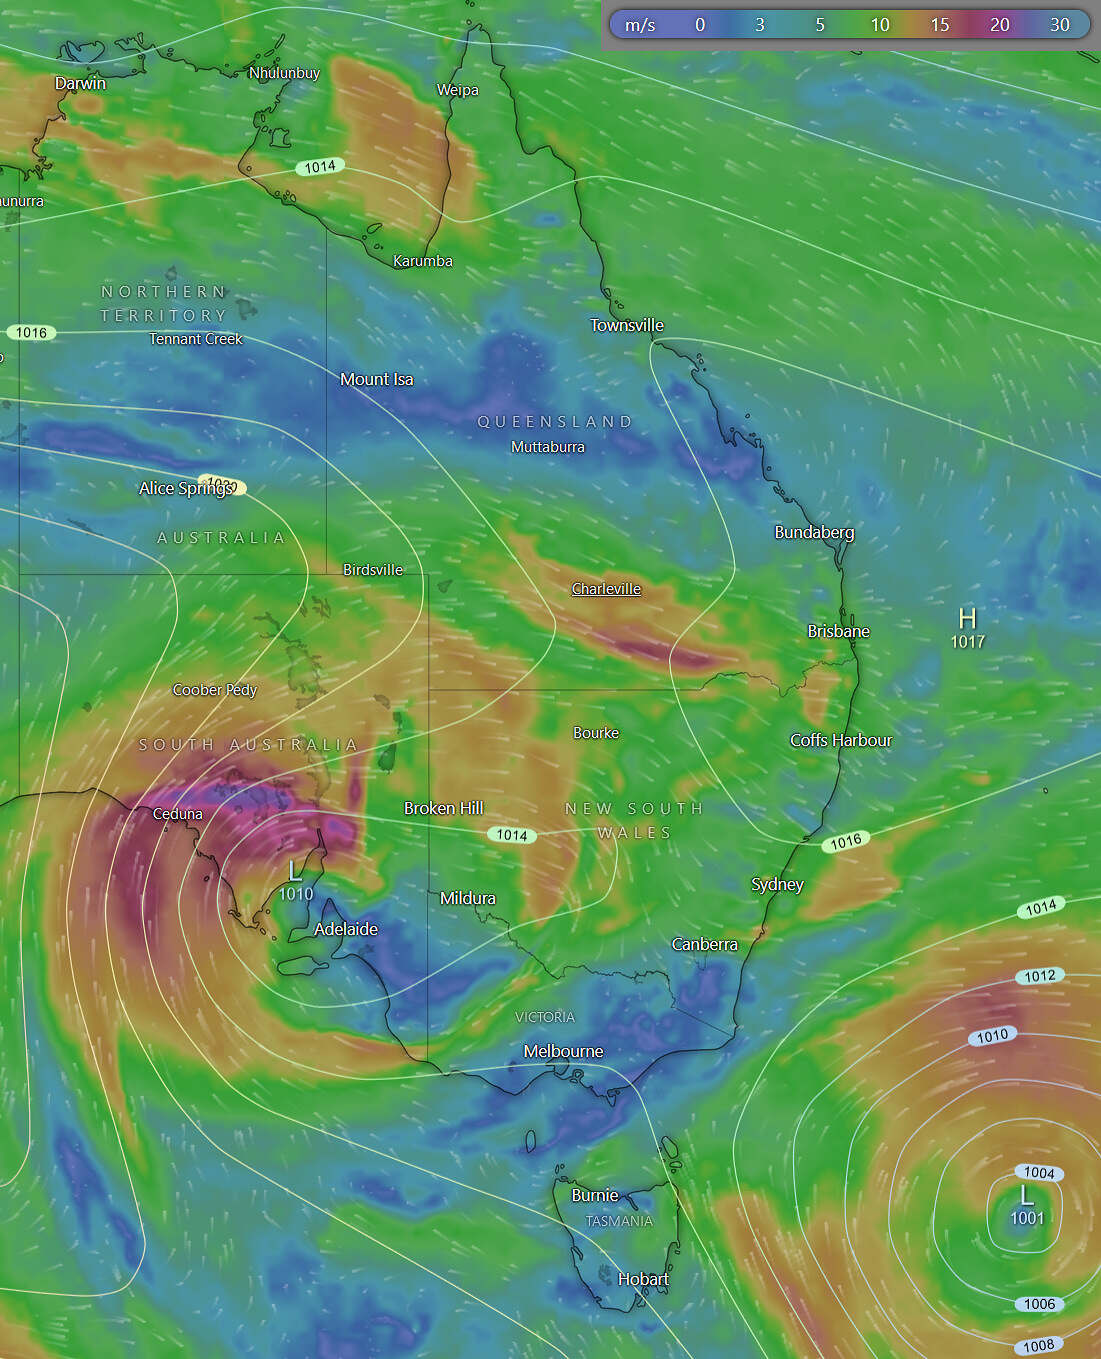
Pressure isolines and wind speeds as at 2pm this afternoon. Shows that a low-pressure system has formed over South Australia, but higher wind speeds are largely confined to the North and West of the Spencer Gulf.
Source: Windy. Elevation at 850hPa
This current weather system has brought higher wind speeds north and west of the Spencer Gulf as we can see in the image above, but unfortunately, we have not seen especially high evening winds in the areas that contain the largest concentrations of wind farms in the eastern part of the state, and in western Victoria. The image below shows the spread of availability across the NEM’s semi-scheduled wind fleet.
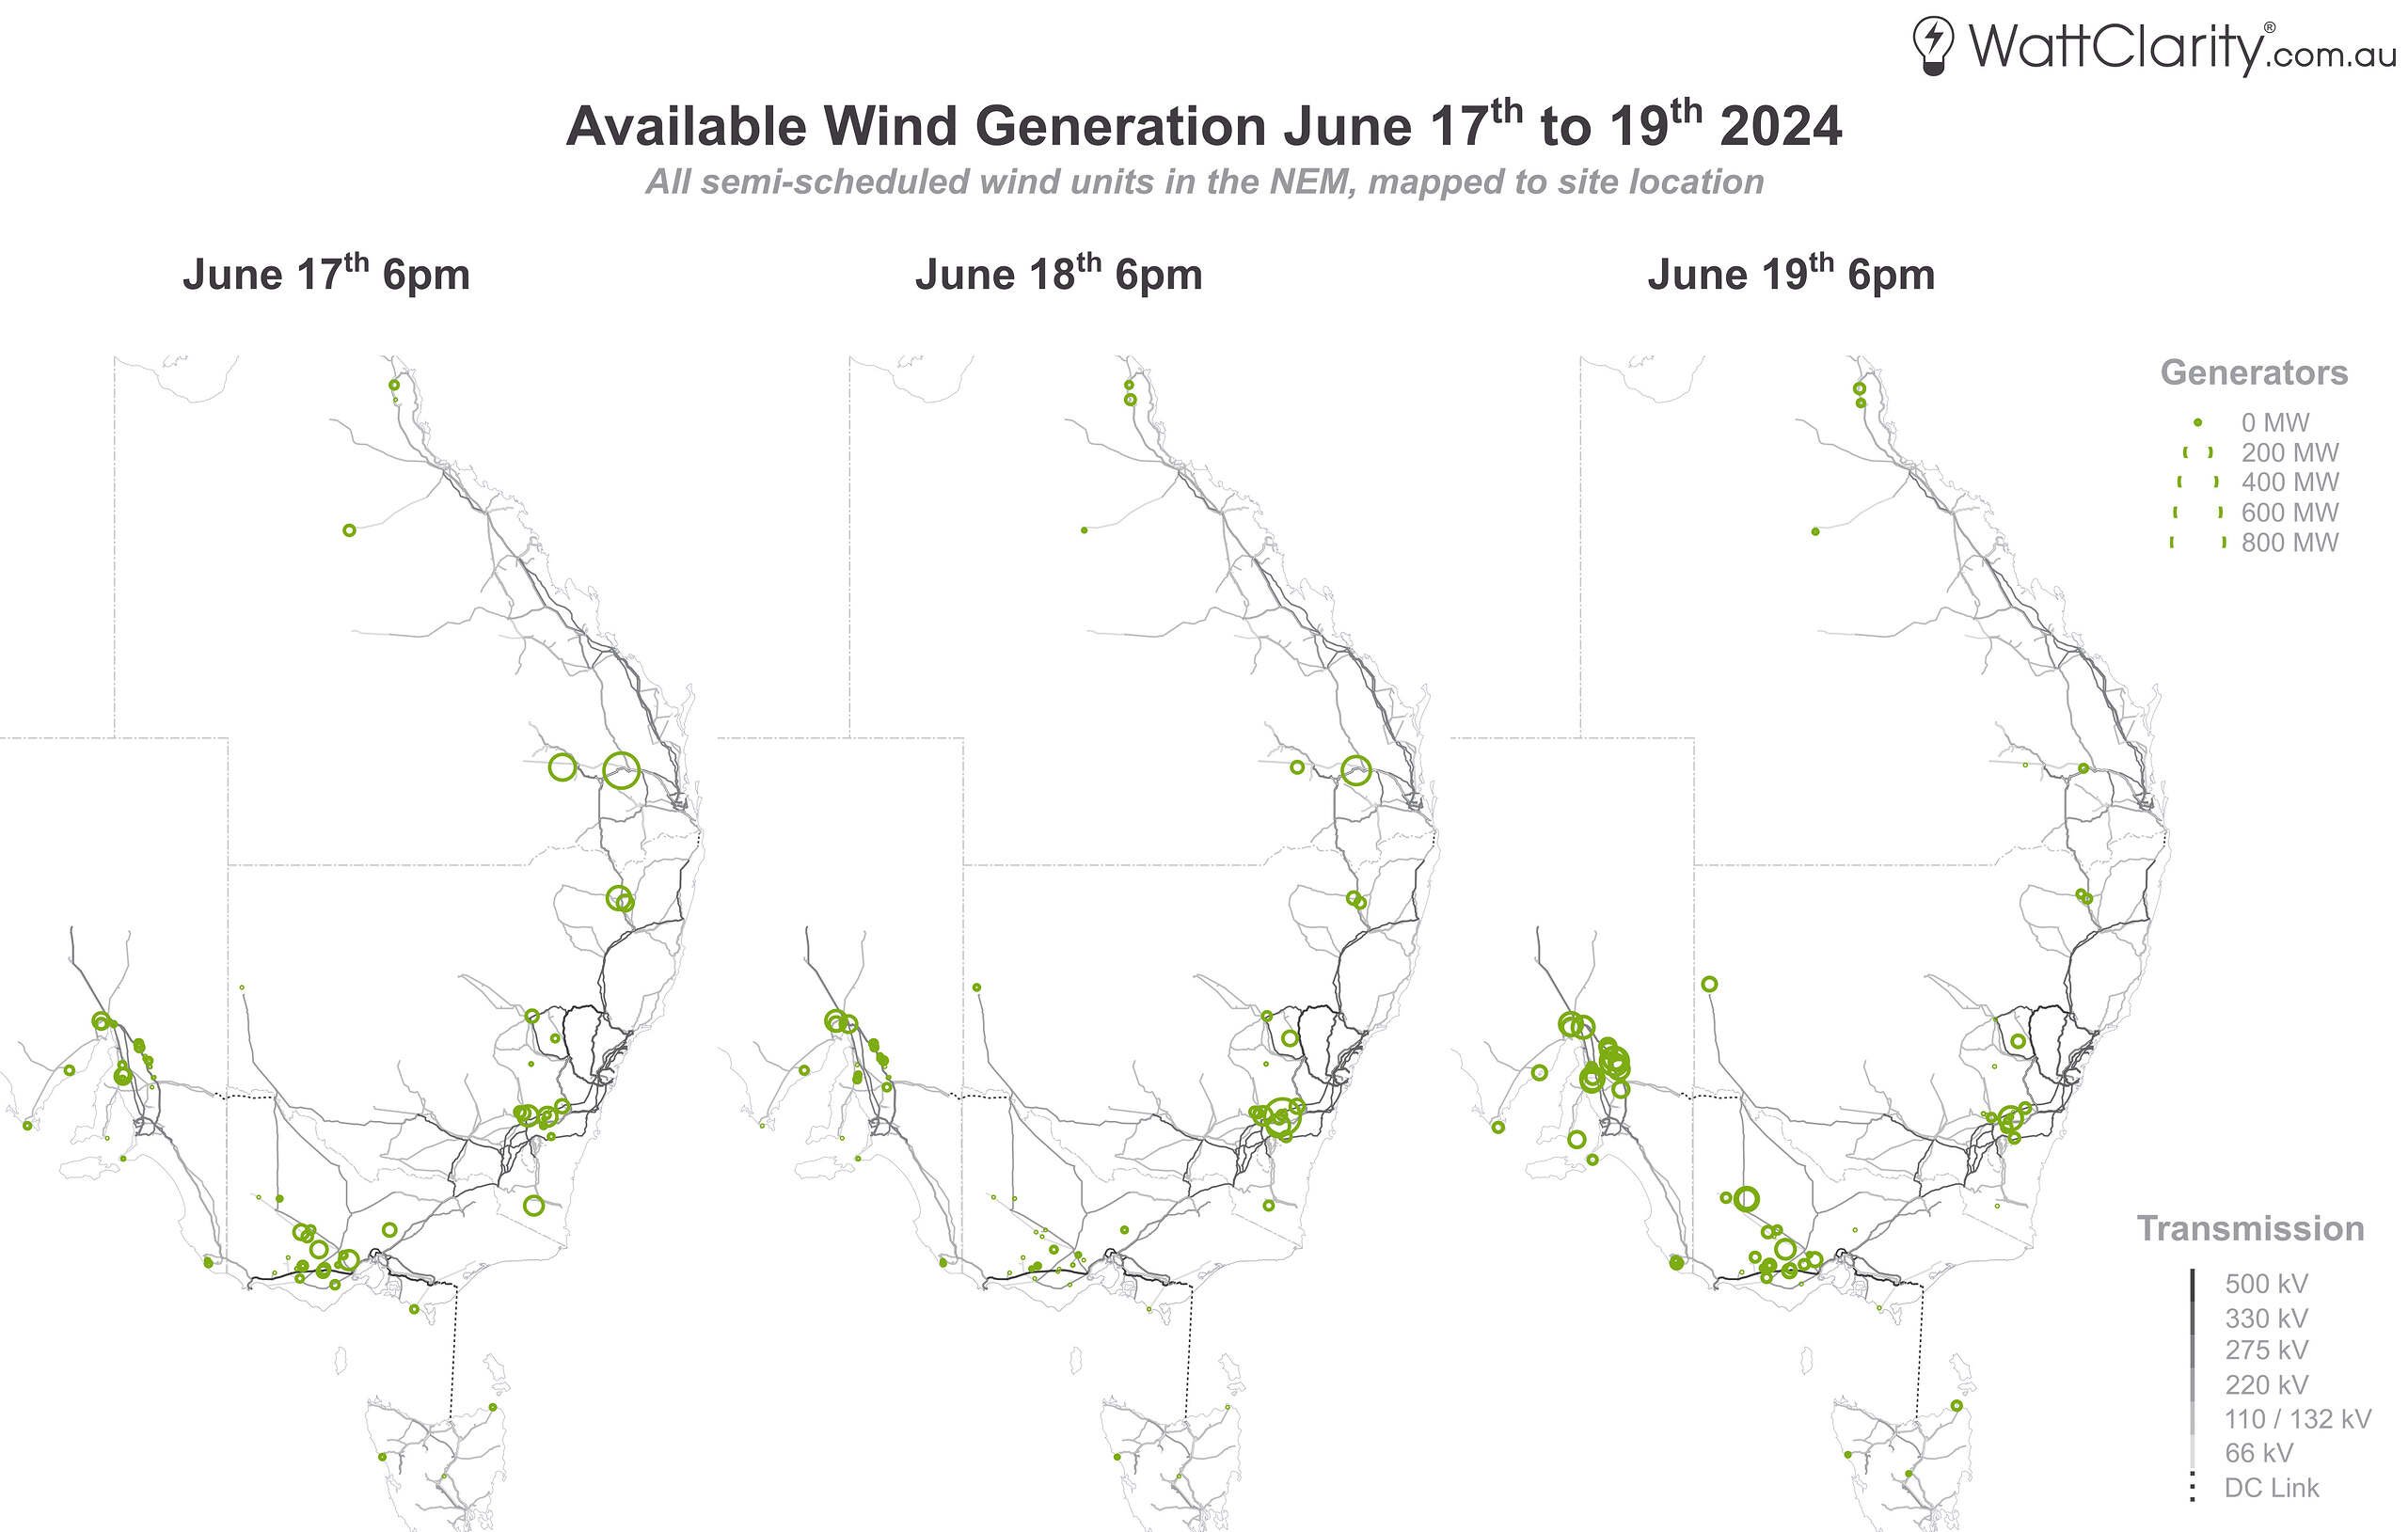
A snapshot of available wind generation as at 6pm, for each of the past three evenings.
Click here for a high-resolution version of this image.
Data source: NEMreview
Going through each of the regions, I note the following:
- Very low wind for the three semi-scheduled wind farms in Tasmania, across all three evenings.
- Relatively low wind in Victoria, and especially so on Tuesday evening (June 18th).
- Relatively low wind available for the large cluster of wind farms in South Australia, although this picked up on Wednesday evening (June 19th).
- Relatively low wind in New South Wales across the three evenings.
- High wind for the two wind farms in southern Queensland on Monday evening (June 17th), but relatively poor yield in the region otherwise.
For reference, the graphic below shows the capacity of each of these wind farms for comparison purposes.
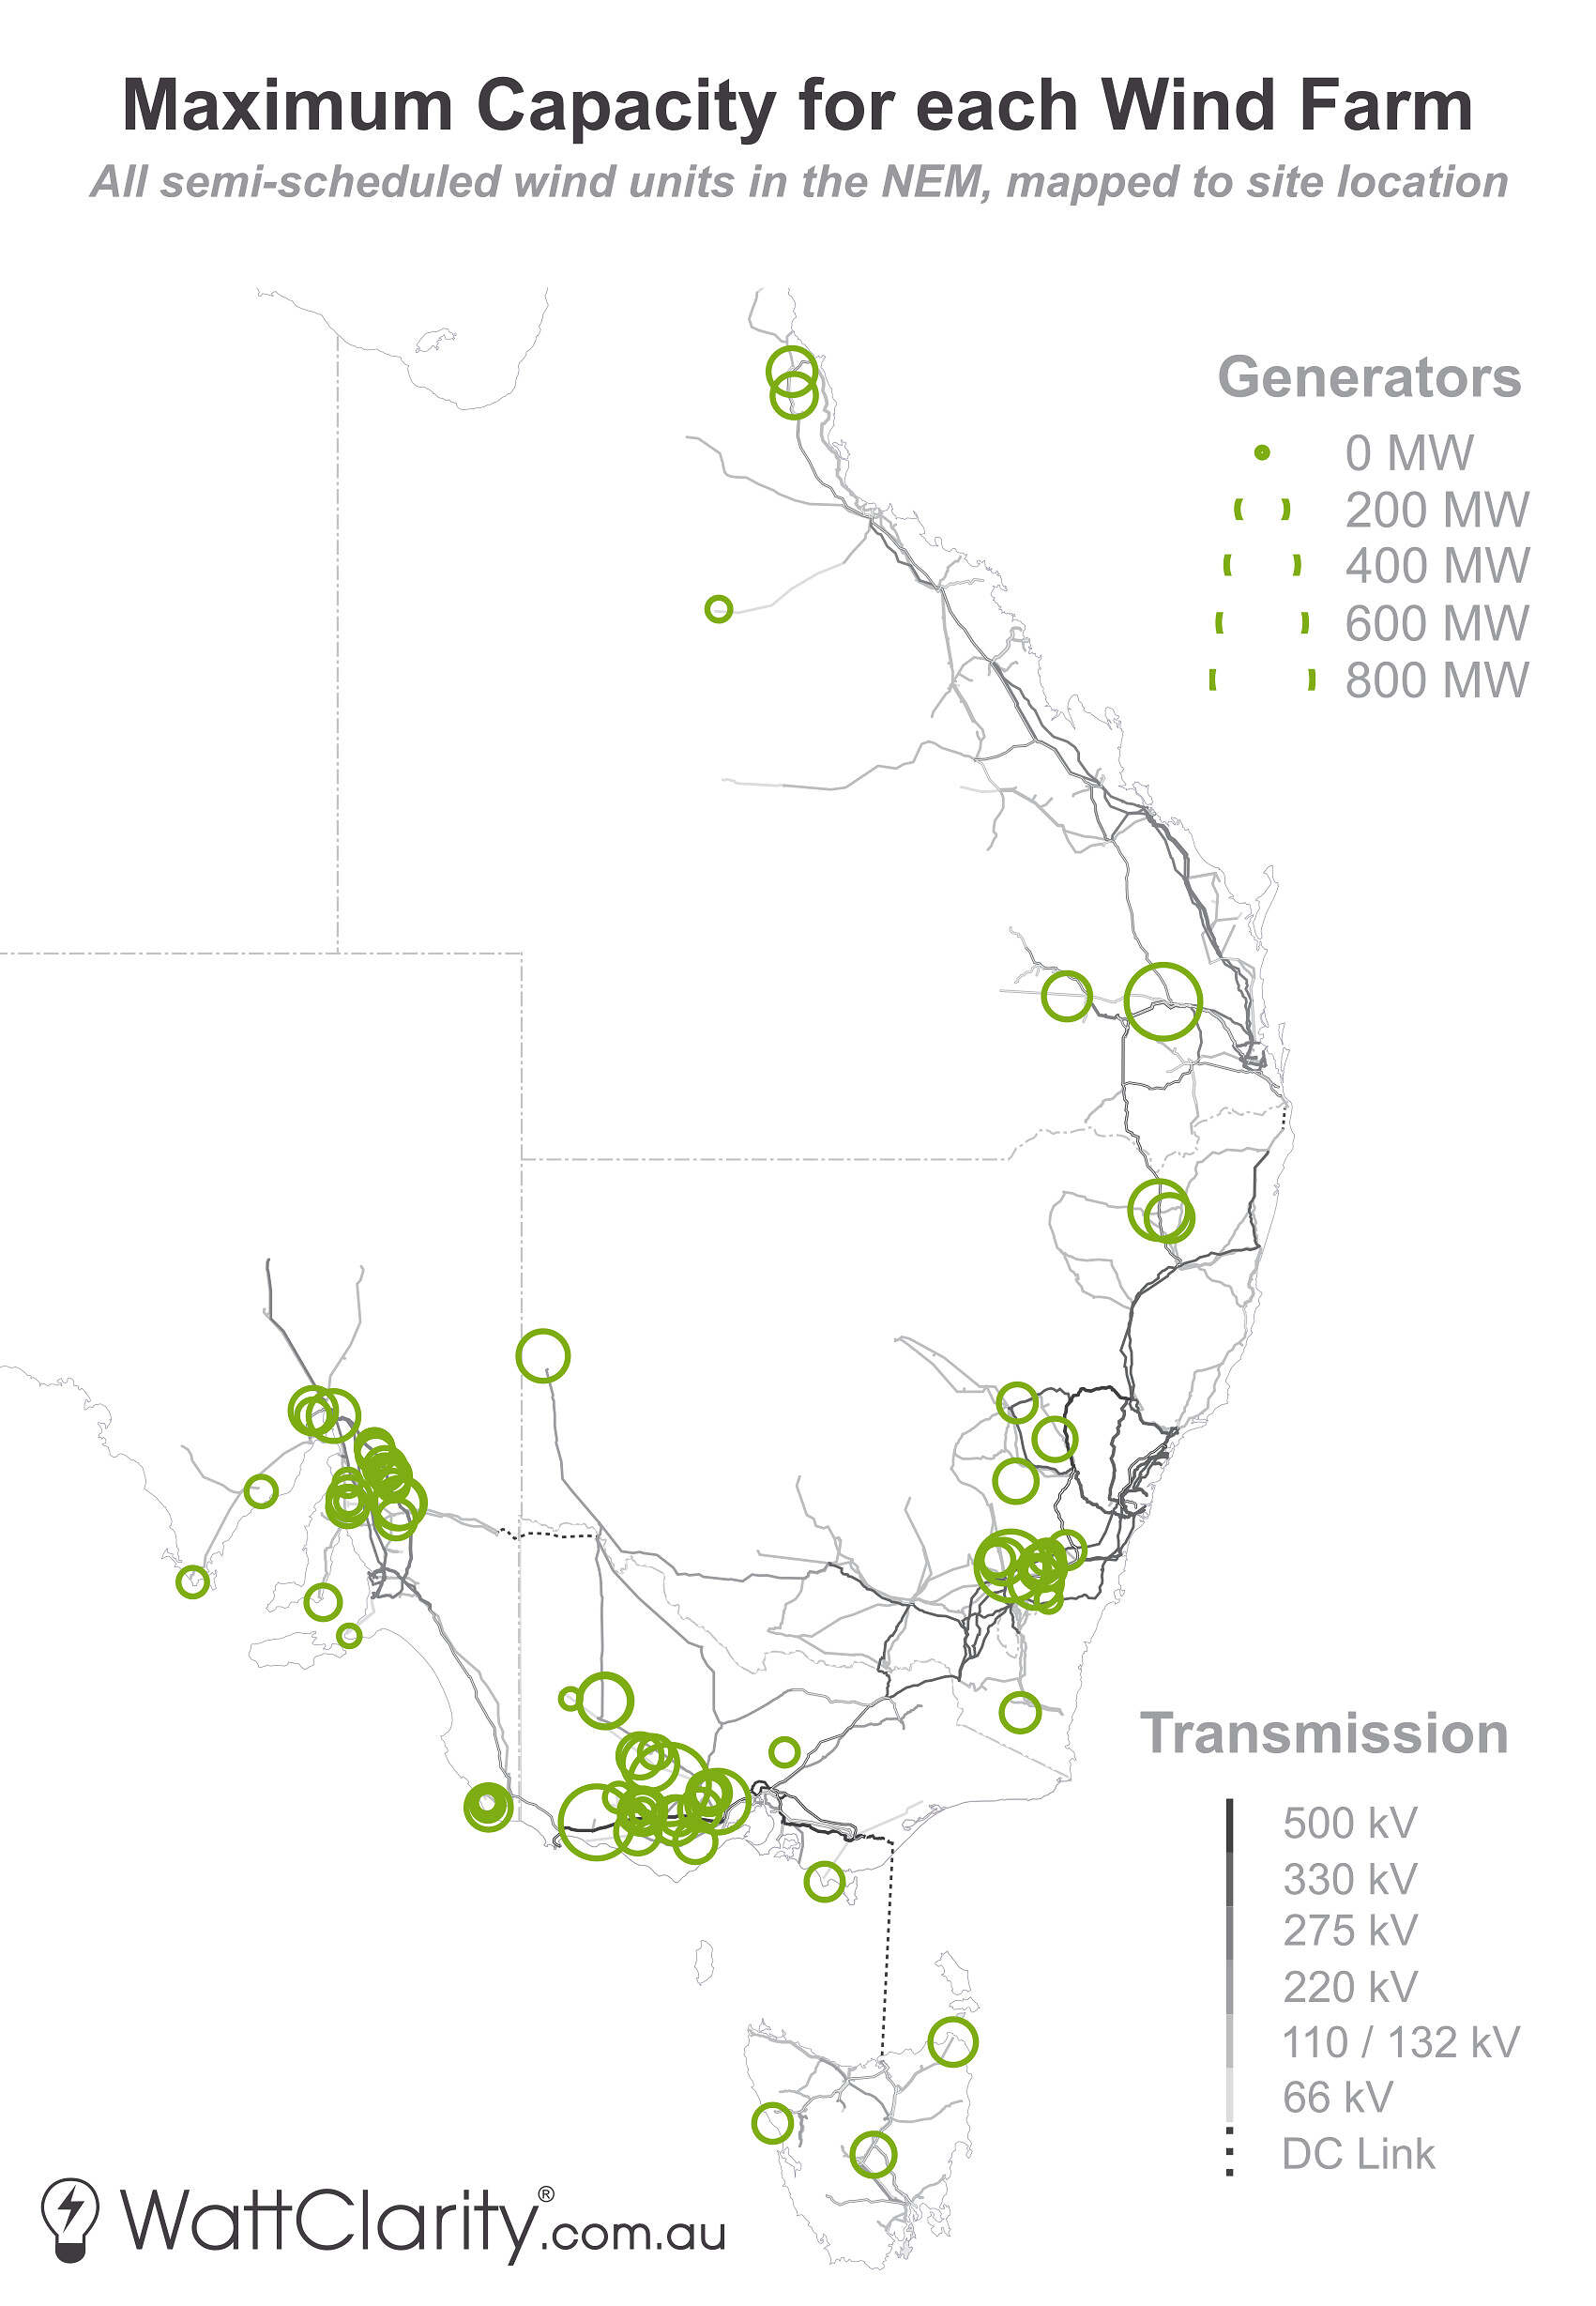
The maximum capacity of each semi-scheduled wind farm in the NEM.
Click here for a high-resolution version of this image.
Data source: NEMreview
Be the first to comment on "A look at where the wind has and hasn’t been blowing over the last three nights"