As noted here in this article, one of the sessions I appreciated the opportunity to attend at the 2025 QCES was one focused on Long Duration Energy Storage…
I’ve already noted how Rimu Nelson illustrated the ‘Changed operational profiles for Swanbank E and Wivenhoe (CleanCo assets)’ … but worth also flagging the following two charts that Rimu talked through to sum up some of the observations he made about some modelled results for some (unstated) year late in the next decade (for one scenario that was not defined in great detail):
Daily Aggregate results for the year of 203Y
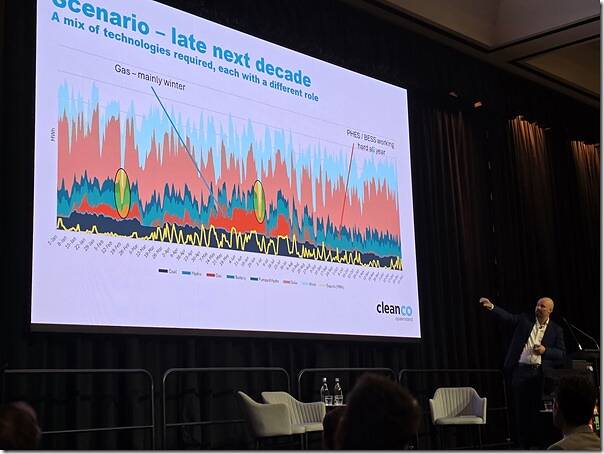
Rimu started with this illustration of the results for the unstated year late in the 2030’s:
Noting that this modelling was just for the Queensland region, and with ‘exports’ being exports from QLD into NSW (i.e. reverse of the interconnector numbering convention used by AEMO), my recollections are that:
1) Rimu highlighted the strong role for gas in this scenario:
(a) not just a few days in the year
(b) but strongest need in winter
2) And also an ongoing supply from coal, which (in that scenario) would not have completely disappeared at that time
3) Rimu highlighted that BESS (shorter duration) and PHES (longer duration) would be working hard for many days in the year;
4) Two particular periods of relatively low solar + wind were flagged … one longer than the other, each with implications for the design of a robust/resilient energy supply mix.
Deeper dive into the month of July 203Y
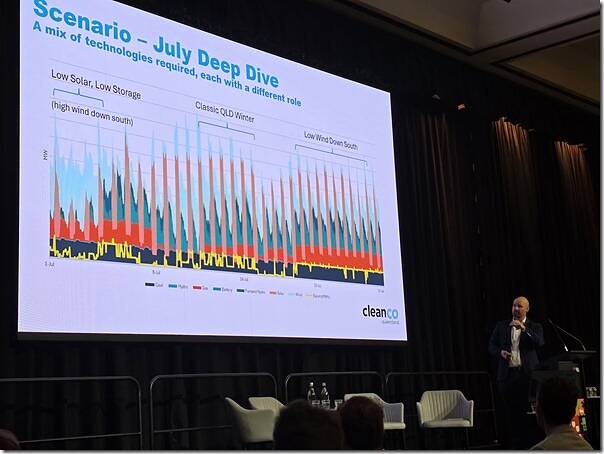
In the following trend, Rimu explained this was a deeper dive into ‘raw’ results (not explained if on a 5-minute or 30-minute basis) from the modelling for the month of July:
For this particular month, Rimu highlighted what the modelling suggested might happened over three periods in the month:
1) With ‘low solar, low storage (in QLD)’ … but with ‘high wind down south’; and then
2) With ‘classic Queensland winter’ (i.e. blue skies so lots of solar)
3) But then a flip to ‘low wind down south’.


Leave a comment