
Several factors made last Monday a standout day in the NEM. To recap, there were at least two weather events impacting market operations:
- A strong cold front swept across parts of southern Australia, bringing powerful westerly winds that drove high levels of wind generation output.
- This also contributed to a heavy dust storm that moved through parts of South Australia and Victoria, significantly reducing solar irradiance and thus affecting both rooftop PV and utility-scale solar farms.
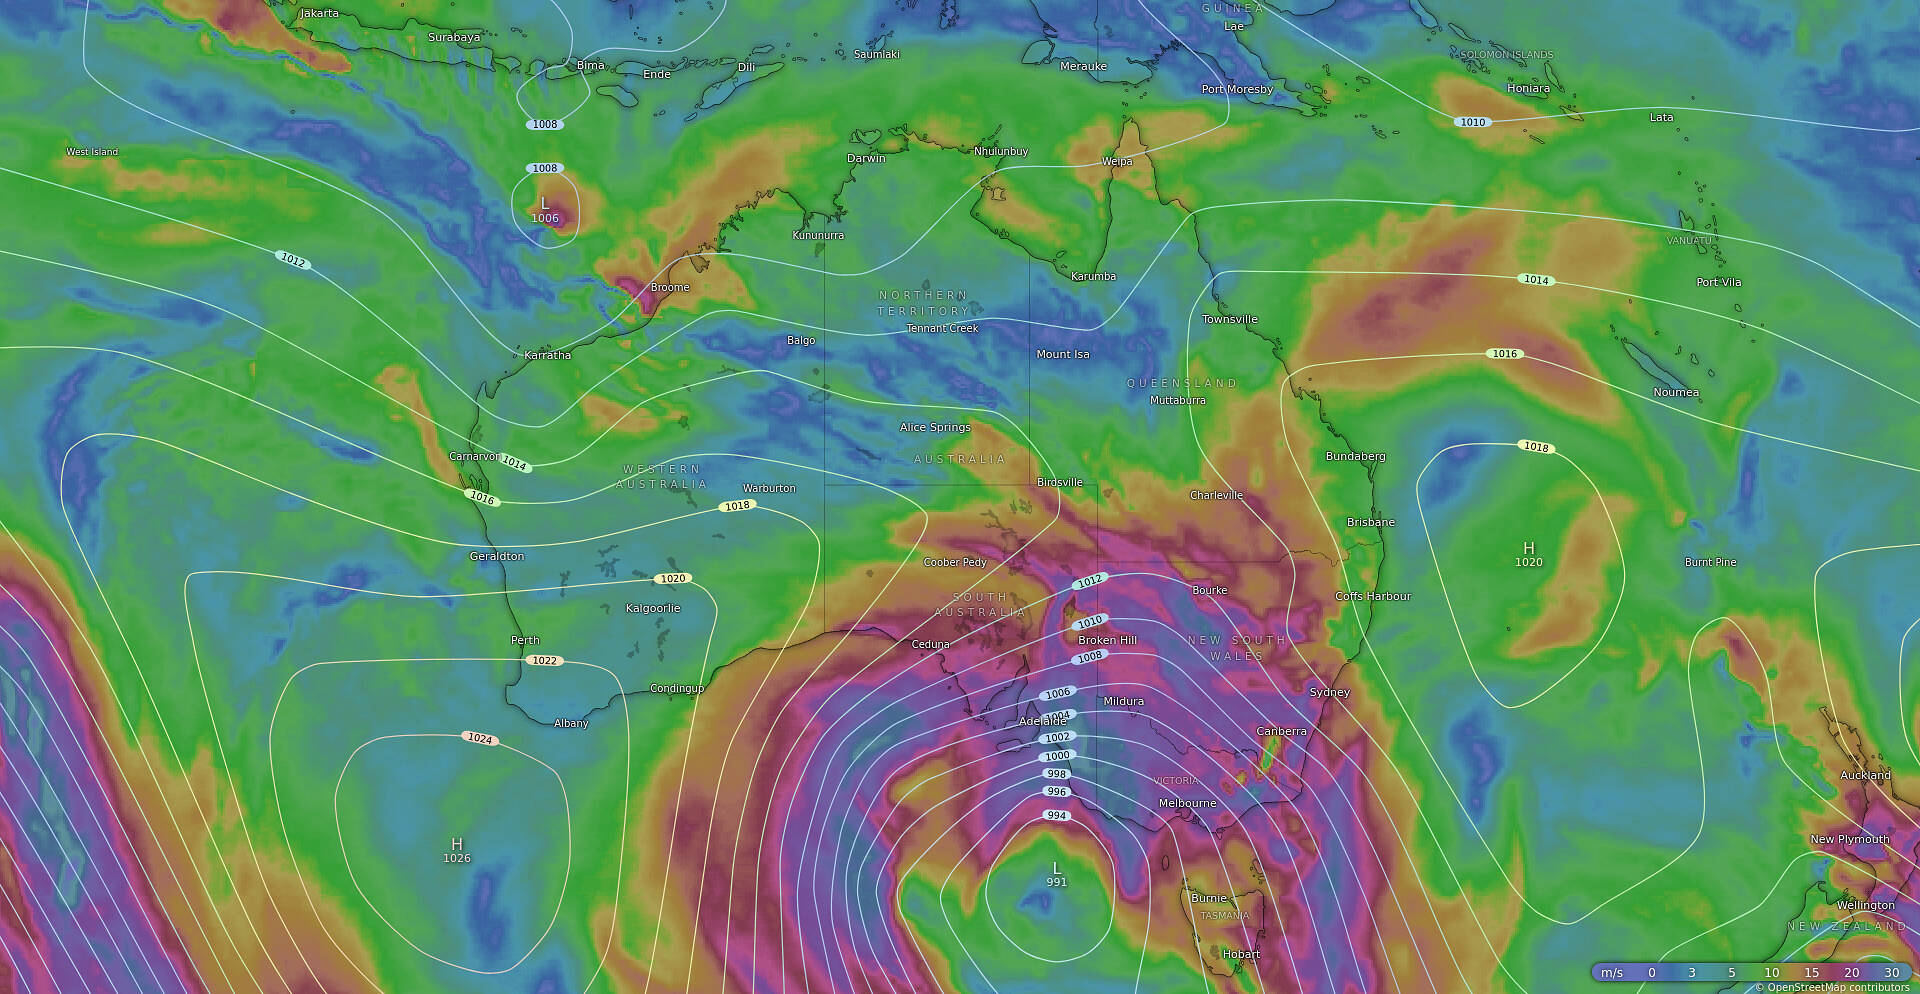
Projected wind speeds, at 850hPa, as at approx. 16:00 (NEM time) on Monday the 26th of May 2025.
Source: Windy
For those underlying reasons—and possibly others—there were several noteworthy events in grid and market operations throughout the day. So far in our analysis posted here on WattClarity, we’ve identified:
- The record for NEM-wide wind production was broken. Wind production reached a maximum of 9,287 MW at approximately 21:35 NEM time that evening.
- South Australia saw two large drops in demand throughout the early afternoon. Market demand in the region dropped by 235 MW at approximately 13:31 NEM time, and later by 213 MW at 14:46 NEM time.
- Mainland frequency briefly dropped out of the NOFB in the late afternoon. Mainland frequency dropped, most notably at approximately 16:15 where it went down to 49.843 Hz — based on a trace from our own frequency monitoring device.
- At around the same time, there was an aggregate dispatch error of 686 MW across all semi-scheduled units in the NEM. Three wind units in VIC demonstrated significant underperformance, but there was material under- and overperformance across the wider wind and solar fleet.
To build on this analysis and continue our ongoing case study of the day’s events, in this short article, I’ll focus on the dispatch errors that occurred for the 16:15 dispatch interval.
In the image below, I’ve mapped the dispatch error for each semi-scheduled units in the NEM for this given interval. In this image, units on the red scale demonstrated underperformance (i.e. a positive dispatch error) and units on the blue scale demonstrated overperformance. Semi-scheduled units with dispatch errors close to 0MW have been greyed out.
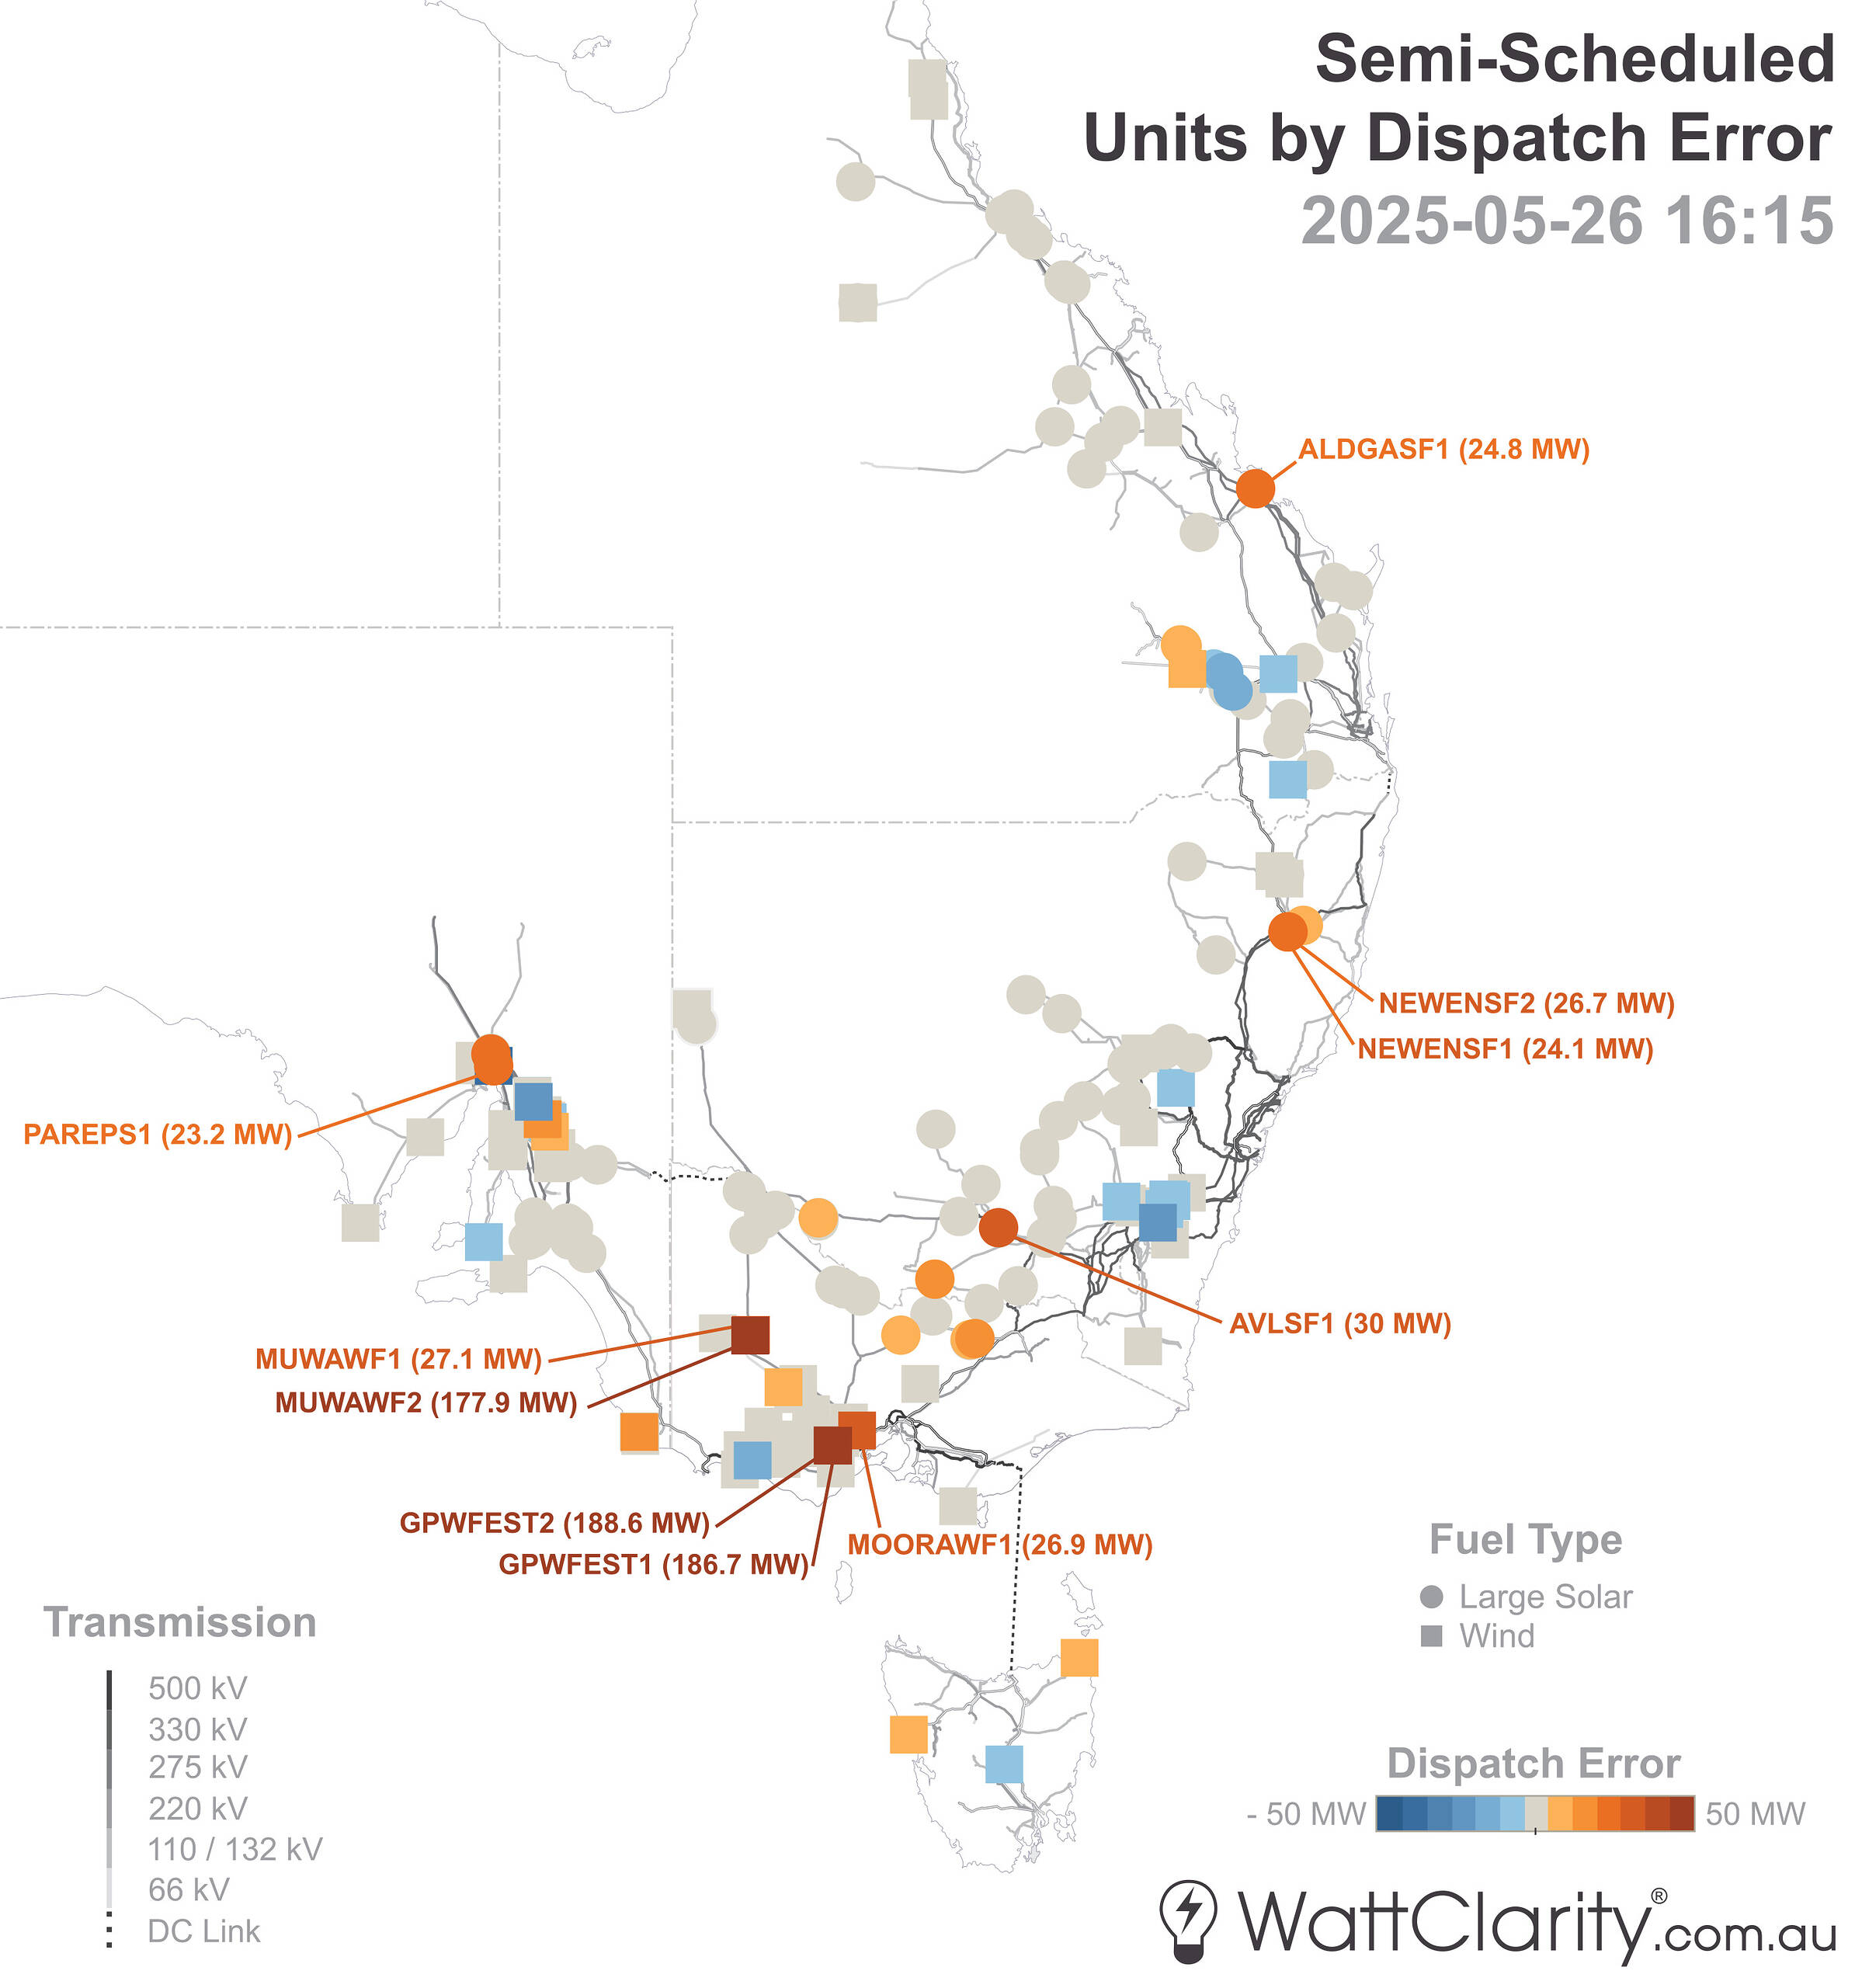
The locations where semi-scheduled units saw material dispatch errors for the 16:15 dispatch interval on May 26th. Units with at least 20MW of underperformance are highlighted with labels.
Source: AEMO MMS
From this map, we can draw a couple of simple conclusions:
- As Paul pointed out in this analysis published a couple of days ago, there were three very significant deviations that occurred at wind farms in Western VIC — but we can see above that this underperformance did not occur uniformly across that area of the NEM. Those three units were Golden Plains WF Unit 1 & Unit 2, and the Murra Warra WF Unit 2. I note that the deviation for Murra Warra WF Unit 1 was much lower, but albeit still significant.
- There were material dispatch errors (e.g. greater than 20MW) much further away, including at several solar farms in NSW and QLD. As we can see on this map, some of this underperformance was somewhat offset by overperformance by other nearby semi-scheduled units.
The reasons behind these dispatch errors are still not entirely clear and could be for a number of reasons e.g. forecast inaccuracy, high-speed wind cut-outs, network constraints not reflected in a dispatch target, other operational factors, etc. As time permits, we’ll aim to add more analysis to this ongoing case study.
Be the first to comment on "A map showing the geographic spread of semi-scheduled dispatch errors on Monday 26th May 2025"