
On 1 May 2025 AEMO CEO Daniel Westerman delivered a speech at the CEDA Climate and Energy Summit.
He discussed how “the ongoing shift in Australia’s generation mix has made our power systems more complex”.
Indicative of that complexity is the number of directions to generators. The number given in the speech was 1,800 in 2024 – almost five a day.
In this article we delve into the indicators we can uncover which point to the increase in market interventions and generator directions over recent years.
AEMO may direct a participant
To paraphrase the rules by copying a section of AEMO’s procedure (SO_OP_3707, 2024) on the matter,
“Section 116 of the NEL and clause 4.8.9 of the NER establish that AEMO may, where it considers it is necessary, direct a Registered Participant (or authorise another person to direct a Registered Participant) to take relevant actions to maintain or restore the security or reliability of the power system, or for reasons of public safety”
Officially, when AEMO issues a direction to a participant it does so verbally, via telephone. Market notices provide confirmation for the participant and/or inform the market more generally. For our purposes, using market notices as a proxy, we should keep in mind that one phone call might not necessarily equate to one market notice.
Market notices concerning Market Intervention are up
Market notices of type ‘Market Intervention’ are indicative of how much the market operator is intervening in the market. Much of the intervention is through directions. Clearly it has sky-rocketed since 2017.
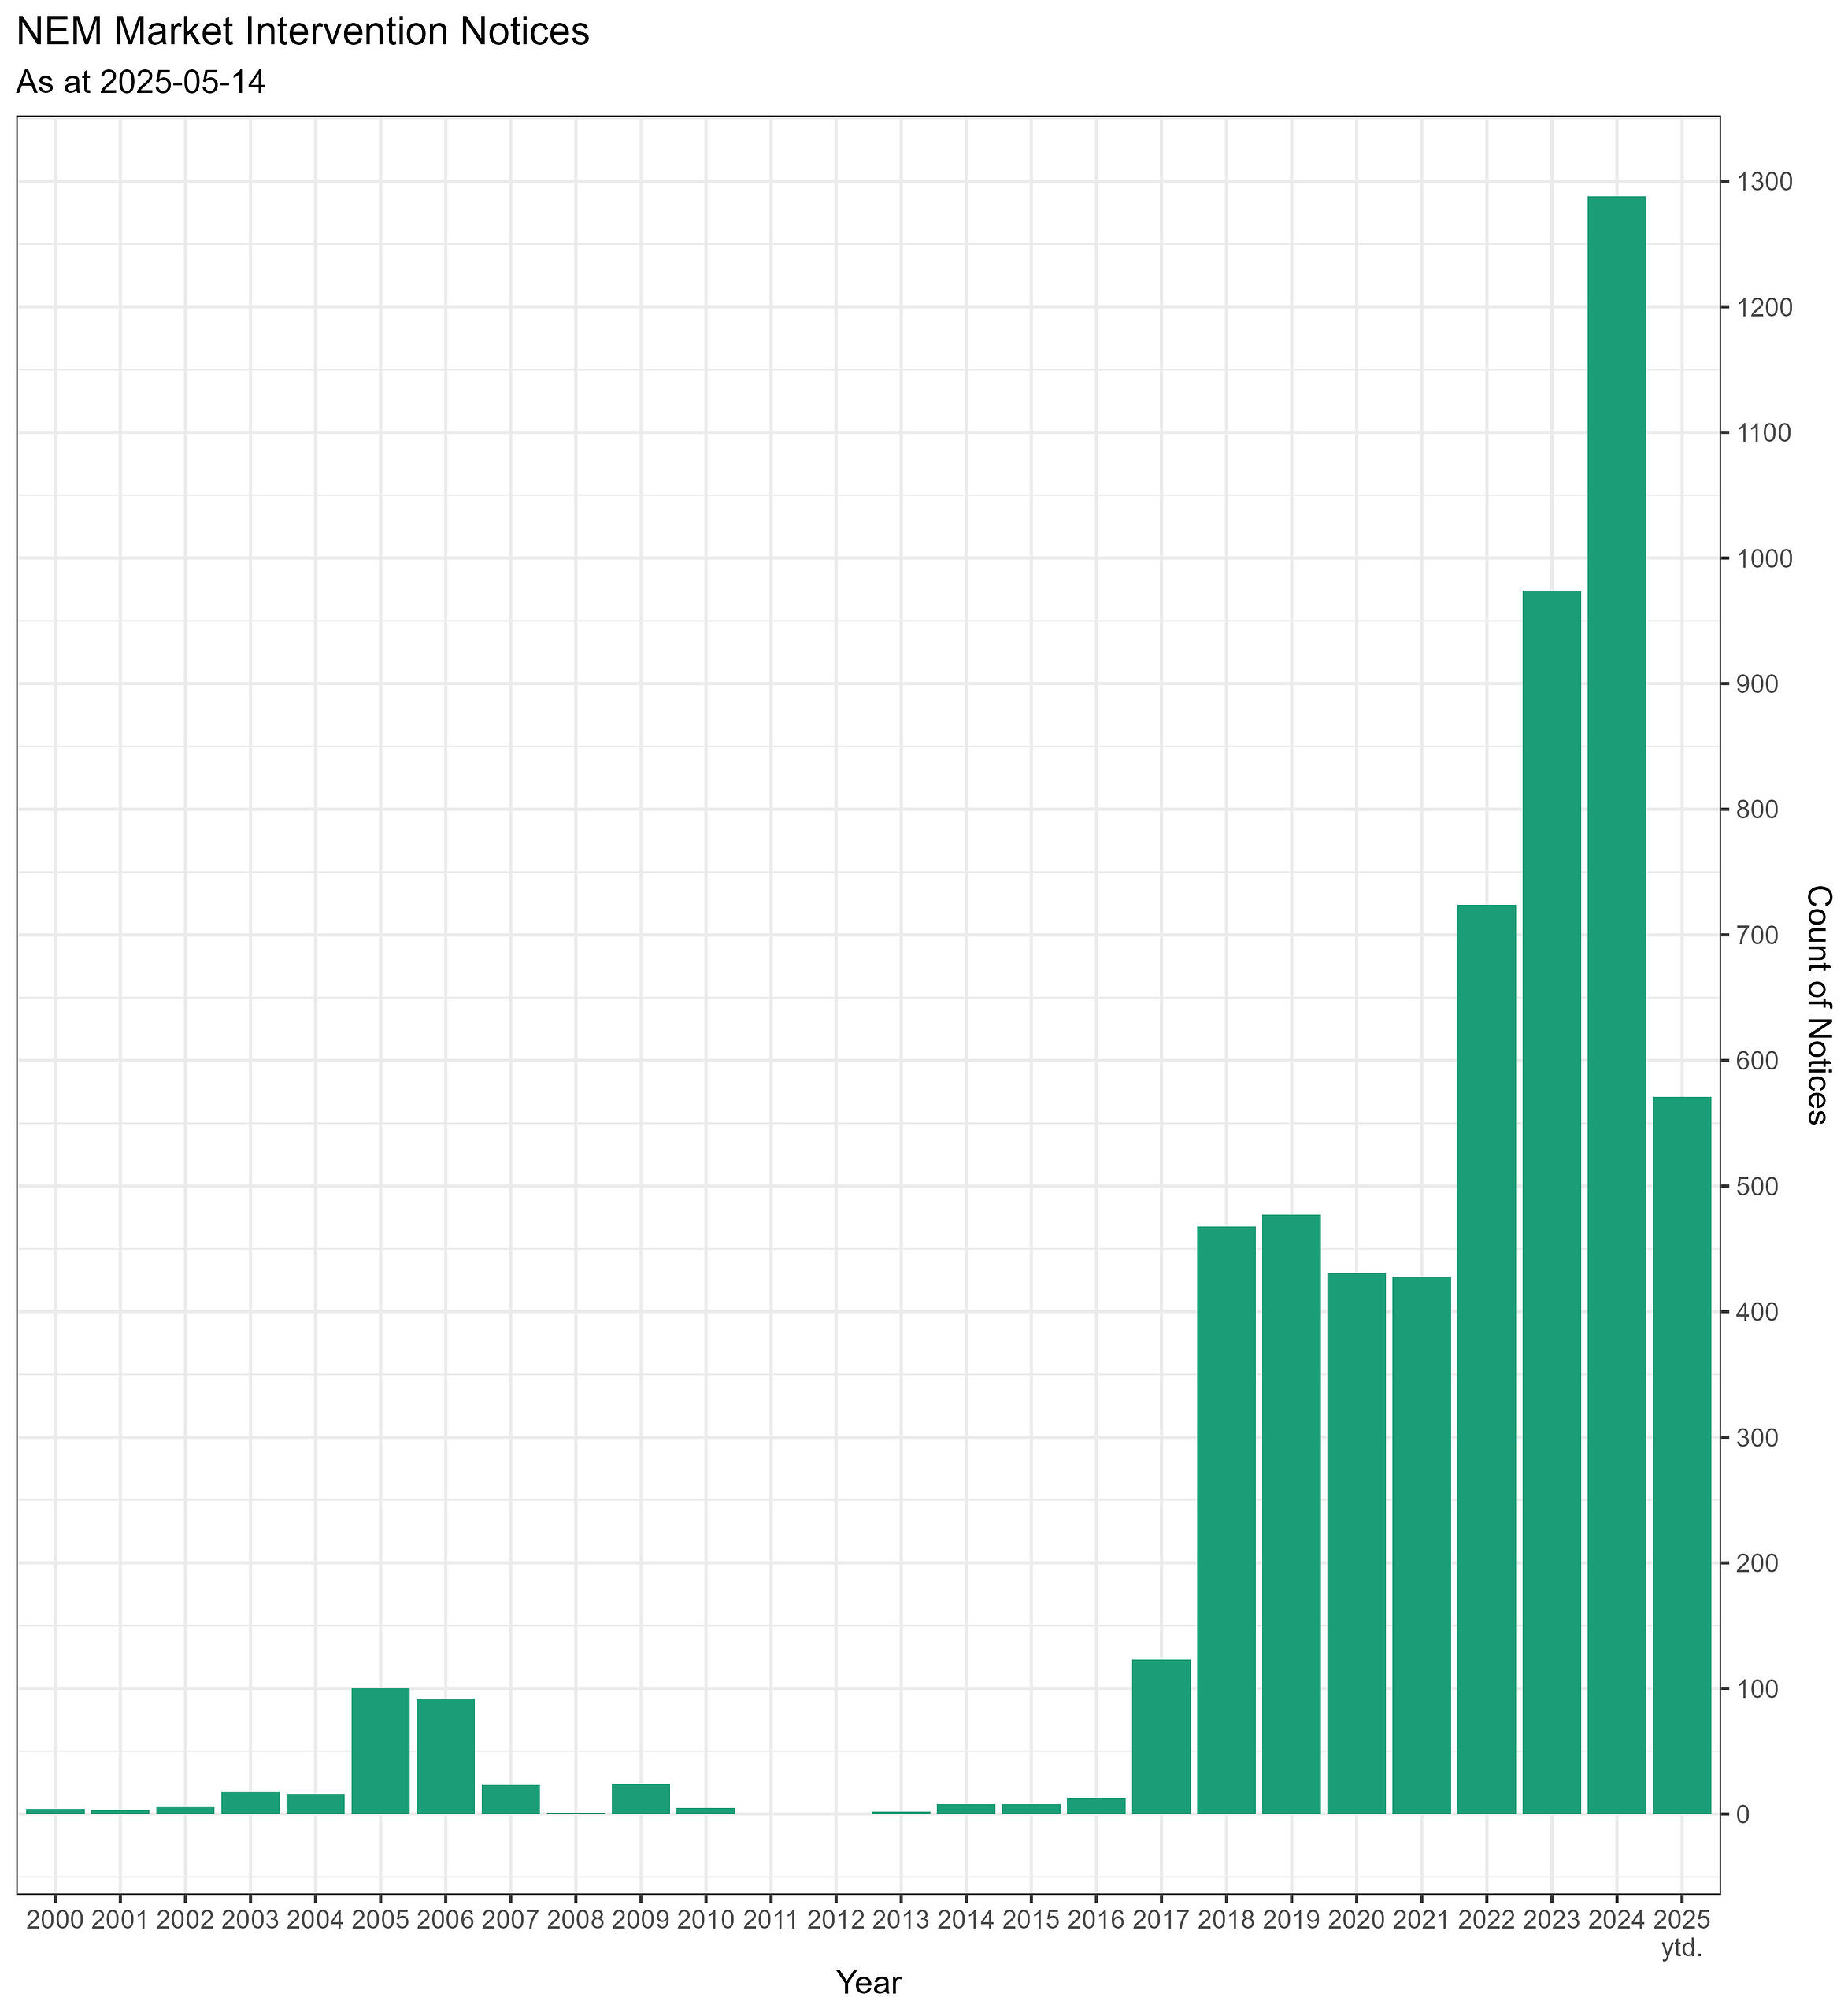
Readers will note the 2024 count of market notices sits at about 1300, not 1800. As we’d noted above a notice may not be a one-to-one match with a phone call.
Further, the ‘Market Intervention’ category of notices covers directions to generators and other interventions. In recent times there have been actions to manage distributed PV and minimum system load. “Latest time to intervene” notices are also observed in this category. Each notice may be for one instance, or refer back to an instance to update, cancel, revoke or correct an earlier notice or instance.
AEMO may include a constraint when making a direction
If necessary, AEMO will apply constraint equations in central dispatch to give effect to the direction and address any technical limitations of scheduled plant.
The key here is ‘if necessary’, and we might also include ‘where possible’. Directions to participants might not match one-to-one to the (quick / unit-specific) constraints used in dispatch. Nevertheless, the count of constraints that we have been able to align with directions is indicative of the increasing frequency of interventions. Caveat: the count represents an approach to filtering the full set and may not be a comprehensive list.
The chart below indicates an increase in the count of constraints on a per period basis (which is typically more than one dispatch interval). This count also lets us separate by region.
We observe most periods, overwhelmingly, are for units in SA. The high count of periods for SA units contrasts to pre-2019 years where the constraints were on units in QLD.
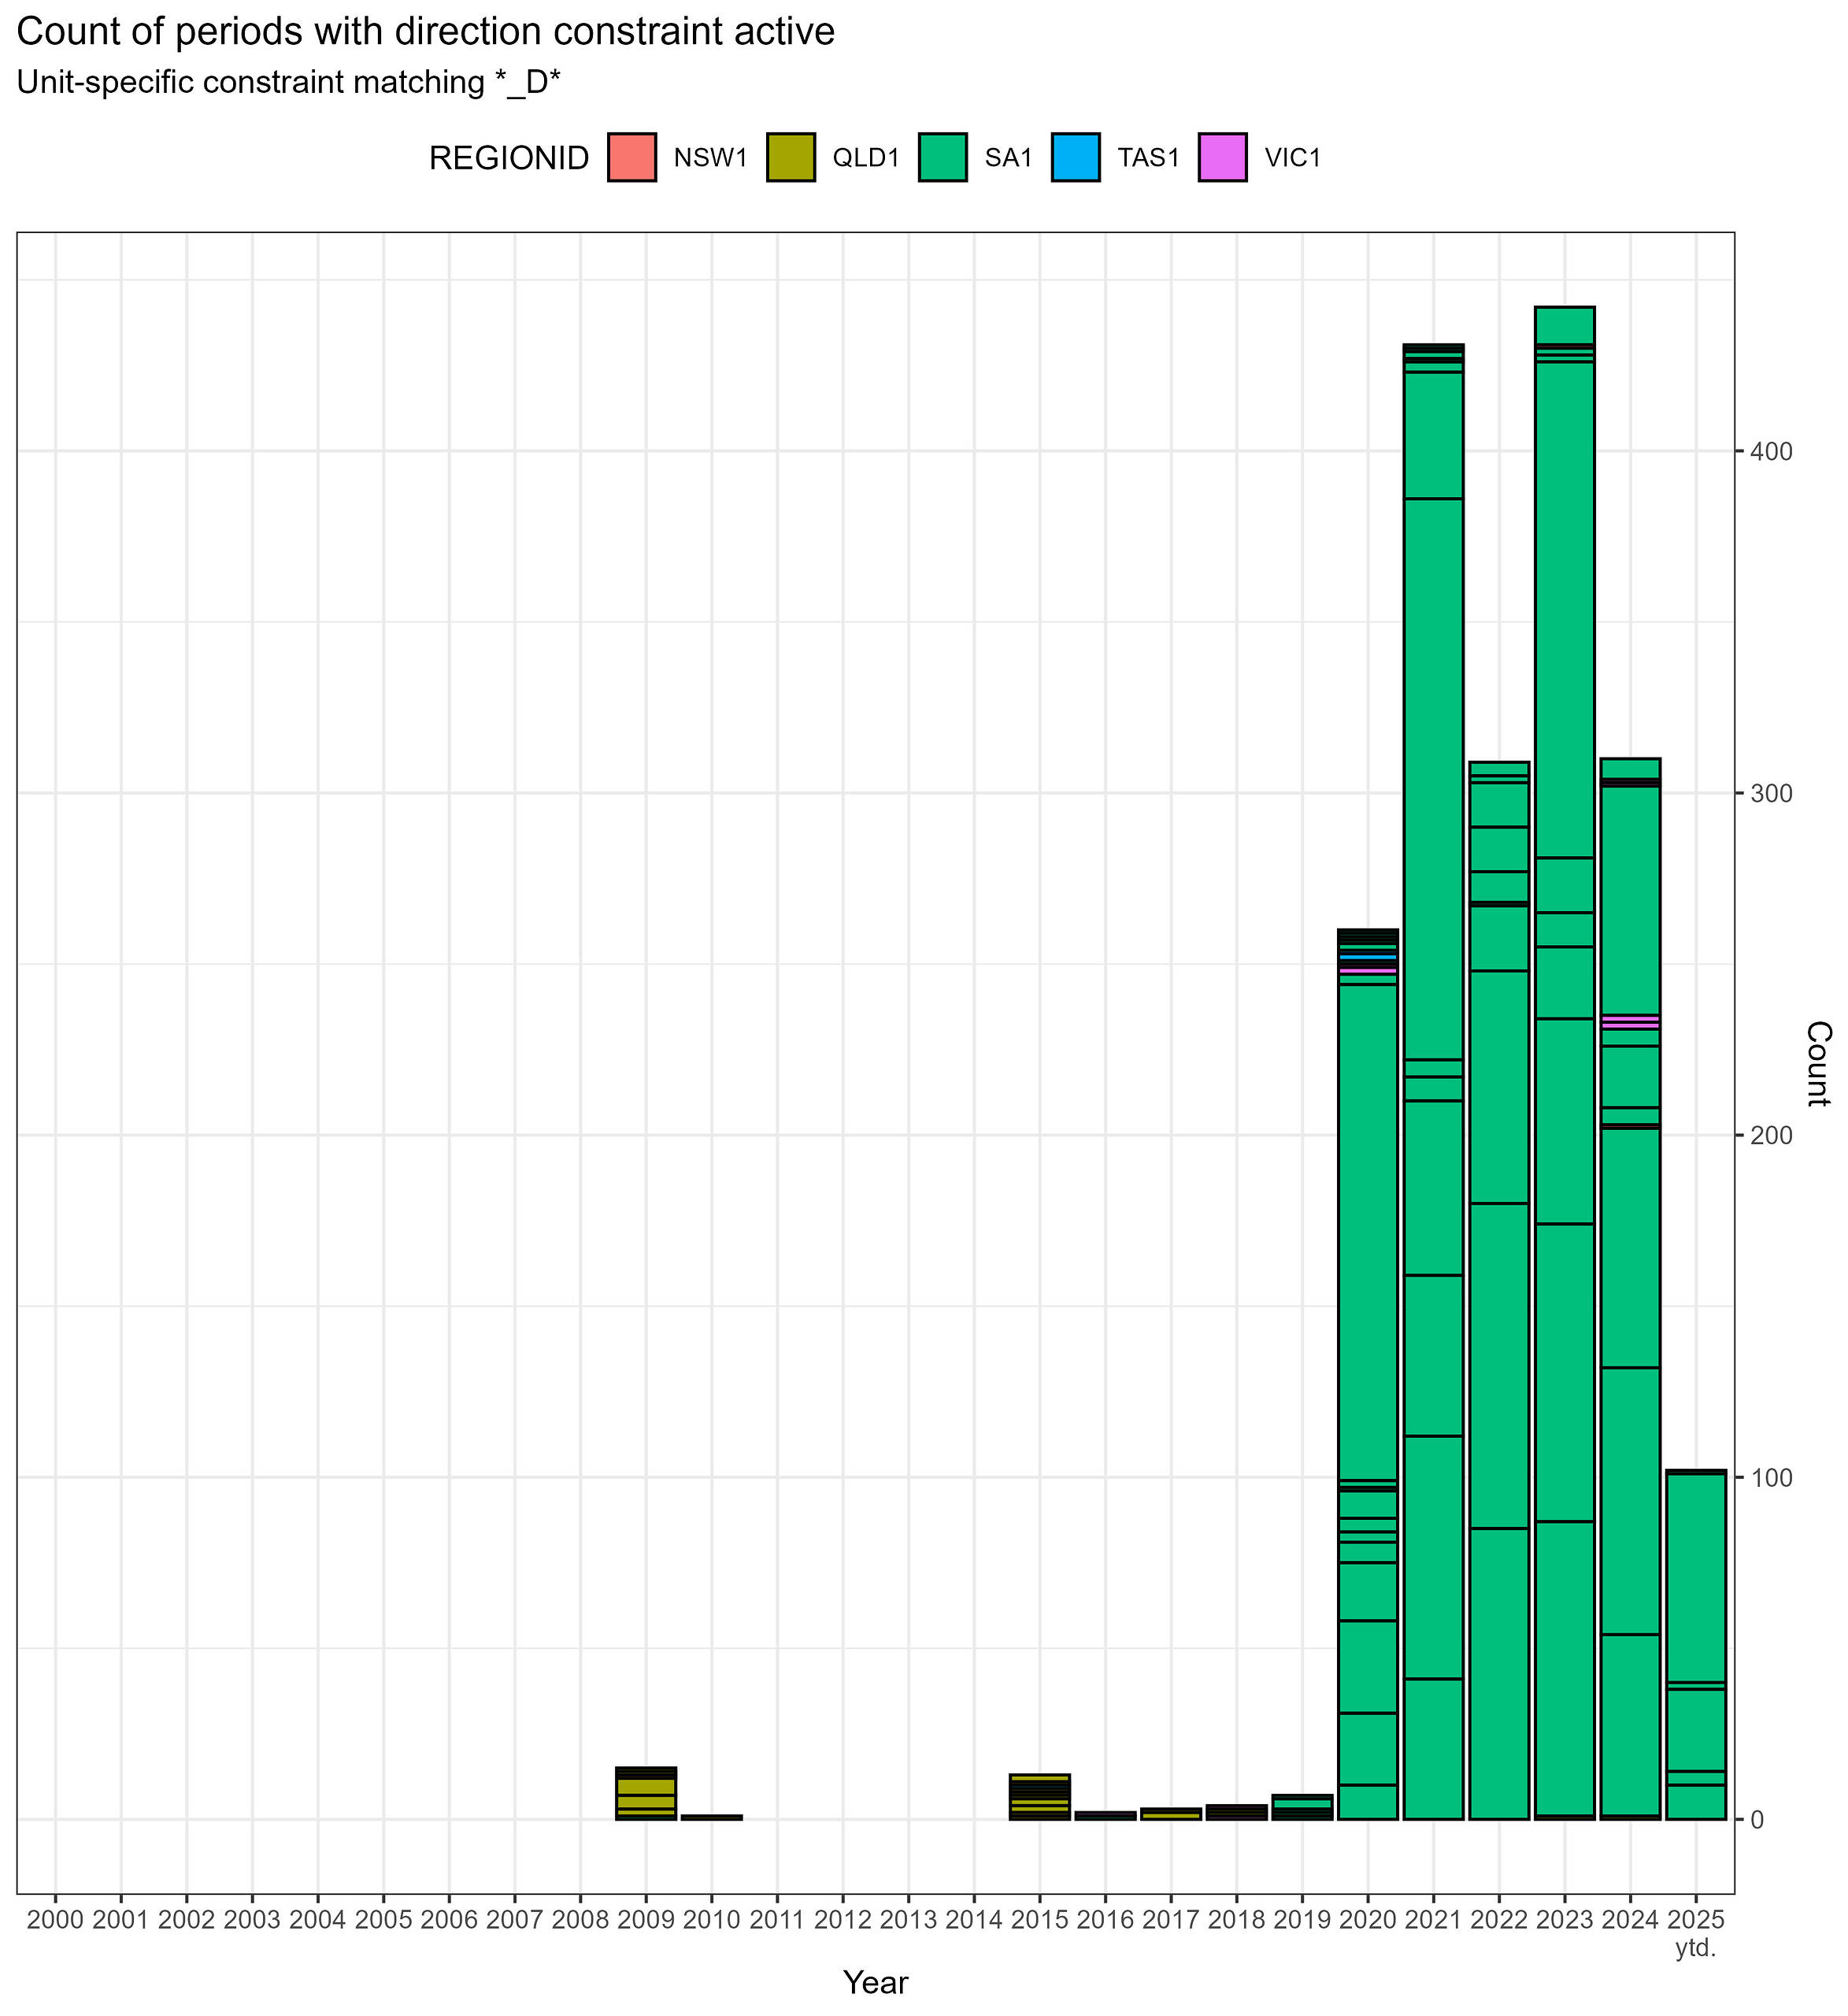
Count of periods where a unit-specific constraint was able to be aligned with a direction. Each segment in a column represents the count of periods for a distinct unit.
Intervention pricing may apply when there is intervention
In the case of a direction (as opposed to a clause 4.8.9 instruction), AEMO will advise the market about the application of any intervention pricing for the purposes of clause 3.9.3 of the NER.
As with the earlier indicators used, intervention pricing would represent a subset of the story on ‘is market intervention increasing’. Not all interventions attract intervention pricing.
When we look at the count of intervention pricing intervals we can see the count has risen.
The most recent stand-out is in 2022 during the ‘energy crisis’ when there was an extended period of administered pricing. Yet the count of intervals for intervention pricing was higher in 2017, 2018 and 2019.
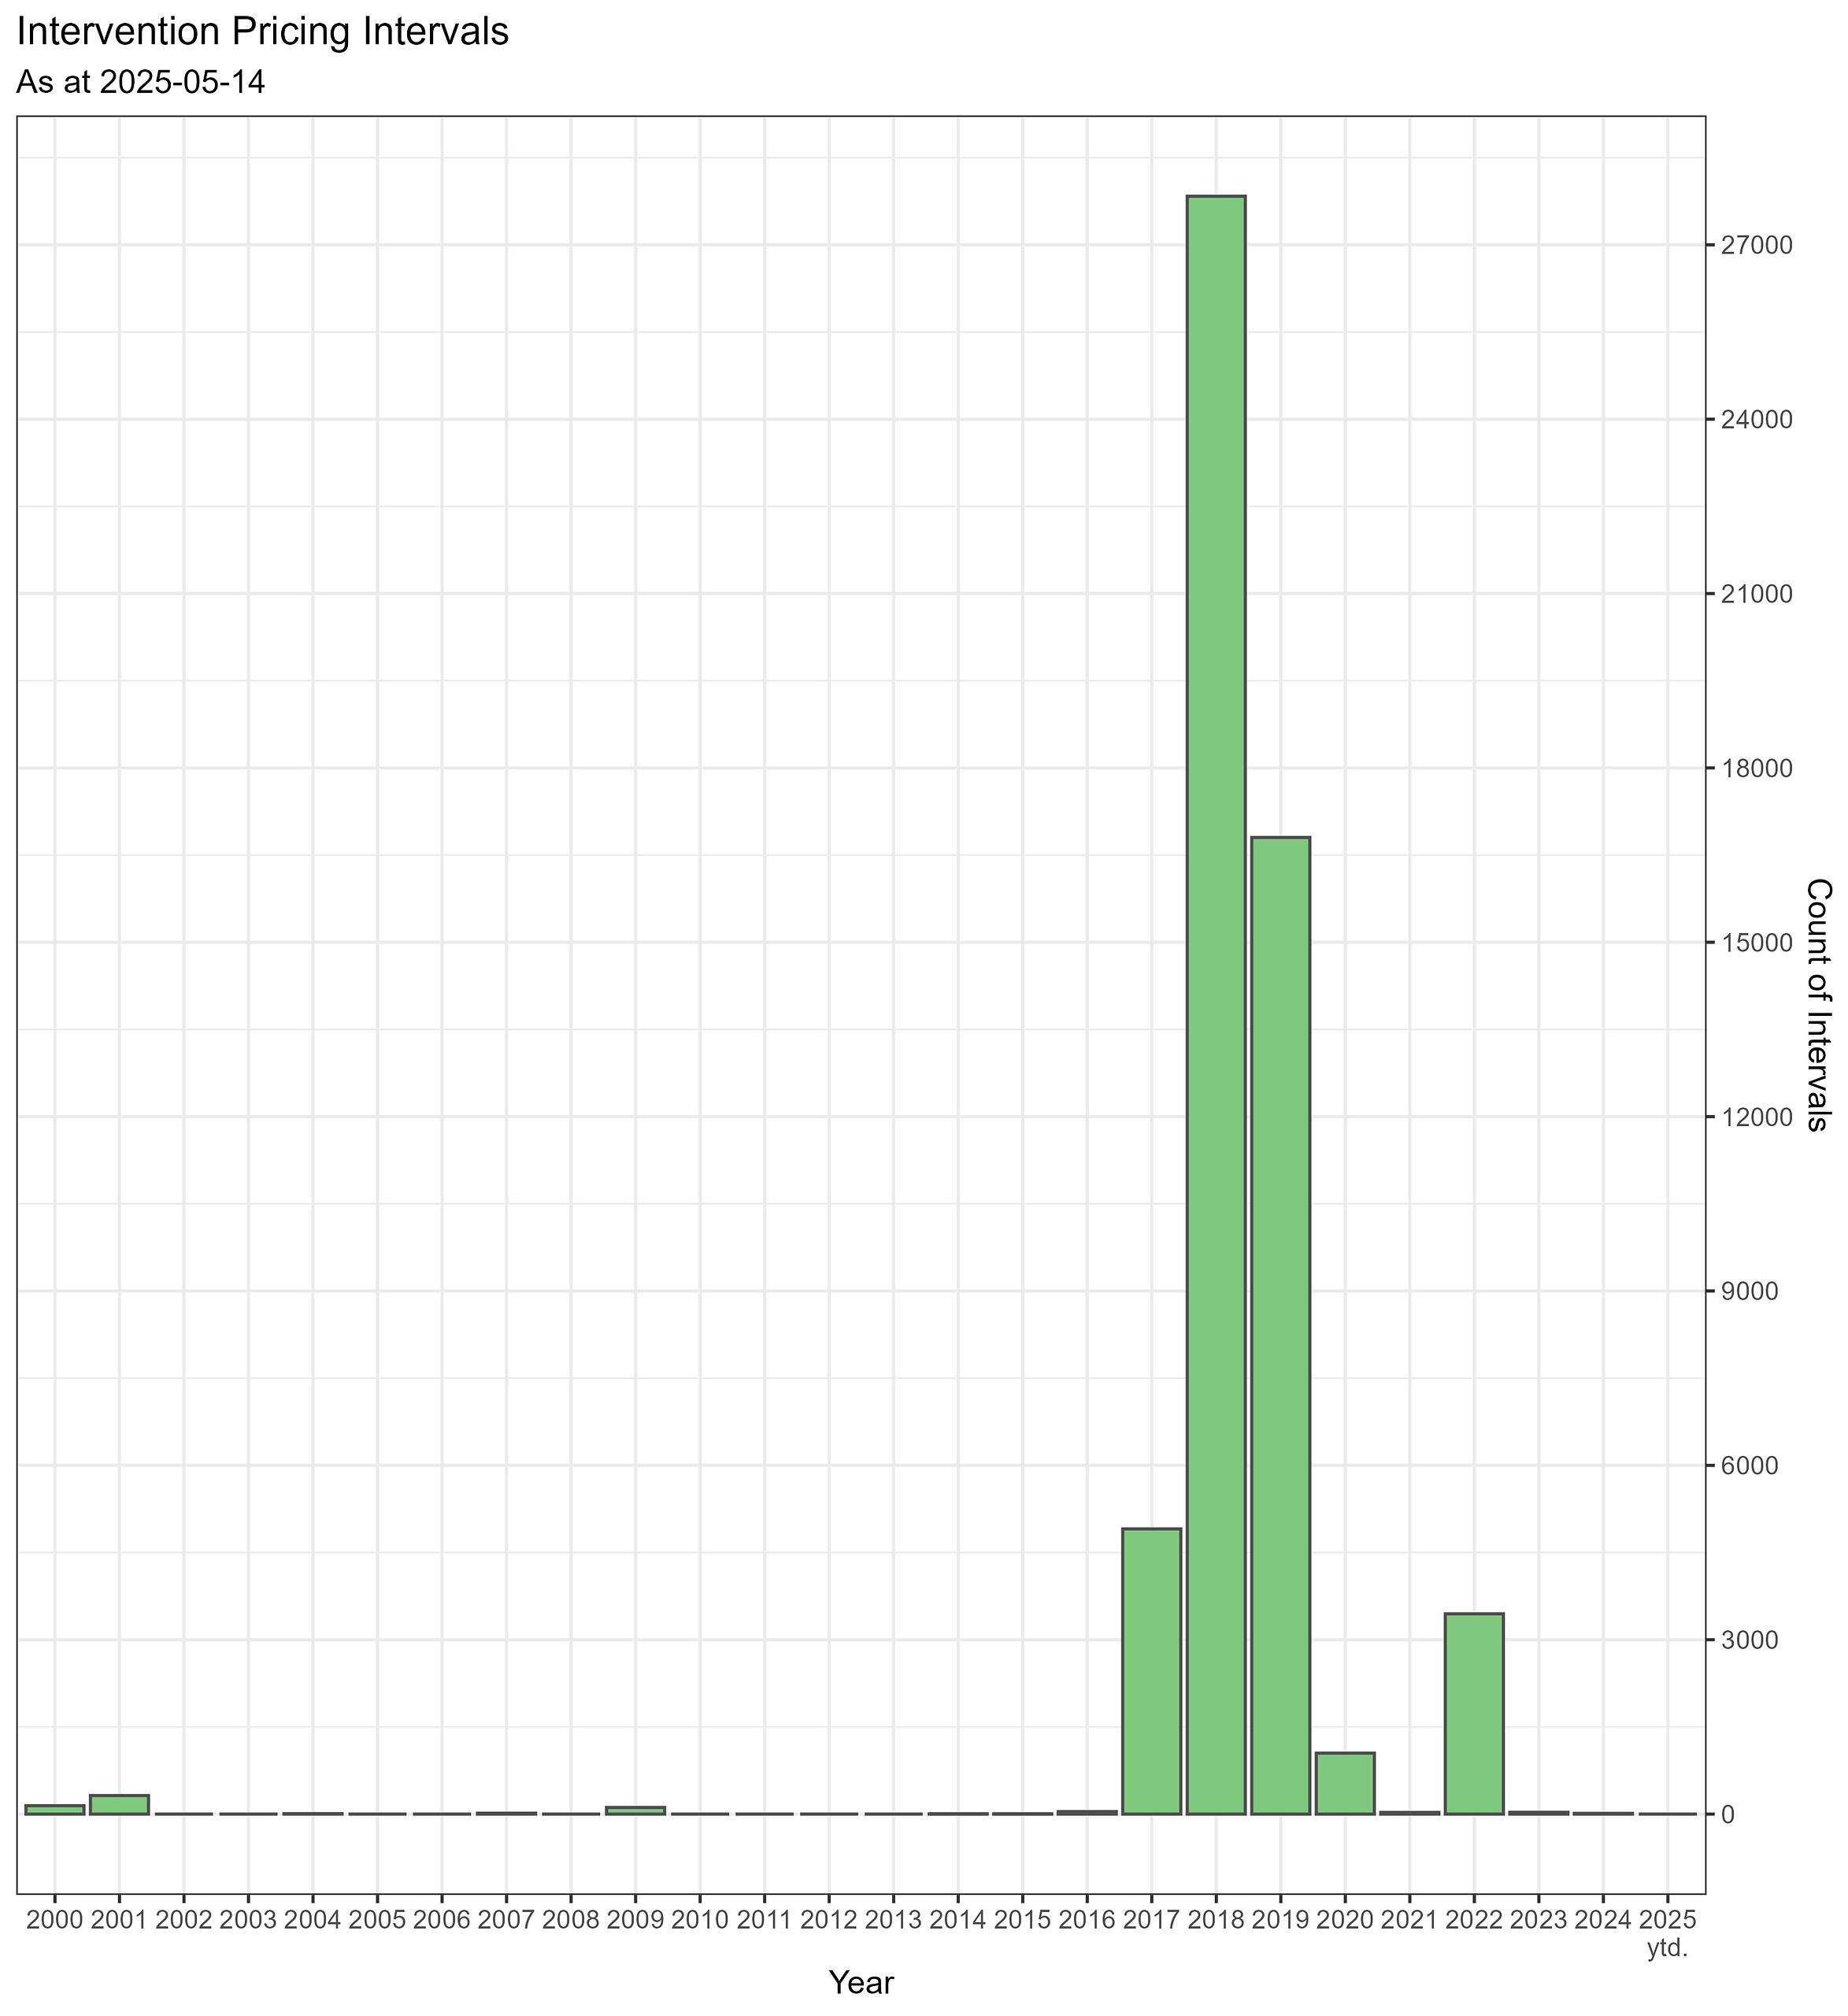
In 2017 peak months were September and October.
In 2018 peak months were spread across the whole year.
In 2019 peak months were generally July to November.
We’ve not delved further into why intervention pricing was so high in the 2017-2019 years in this article, and whether it relates to the directions for system strength gaps in SA from late 2017 onwards.
“We’ve not delved further into why intervention pricing was so high in the 2017-2019 years in this article, and whether it relates to the directions for system strength gaps in SA from late 2017 onwards”
Yes initially synchronous unit requirements in SA were delivered via intervention (with associated intervention pricing). There was a rule change at the end of 2019 which clarified applicability of intervention (ruling it out for these circumstances), subsequently AEMO started directing the units instead (with no intervention pricing applied) – see https://www.aemc.gov.au/rule-changes/application-regional-reference-node-test-reliability-and-emergency-reserve-trader
Thanks HR10 for the confirmation and background!