We already noted how there was a ‘New all-time record for NEMwide production from Wind on Monday 26th May 2025’ …
1) and, in that article, made the statement ‘the actual level was considerably higher than earlier forecasts, as well.’
2) So I thought it was worth exploring the ‘is VRE forecastable’ question a little more.
The simple (simplistic?) answer
Of course, one might even read earlier WattClarity articles and conclude the answer is a YES:
- On Monday morning (about 13hours ahead) we’d written ‘*Might* be a new all-time record for NEMwide wind production on Monday night 26th May 2025’; and
- Even back on Friday (more than 3 days ahead) we’d written ‘Forecast for high wind capability across the NEM on Monday 26th May 2025’.
… but that might be a bit too simplistic?
A more nuanced (and useful) answer
If you’re looking for discussion points on social media, perhaps you won’t look any further … but if you’re more focused on practical decisions (keeping the lights on, or balancing a portfolio contract position, etc) then it might pay to read on for more.
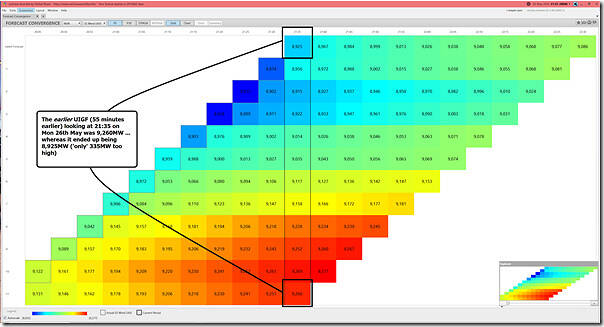
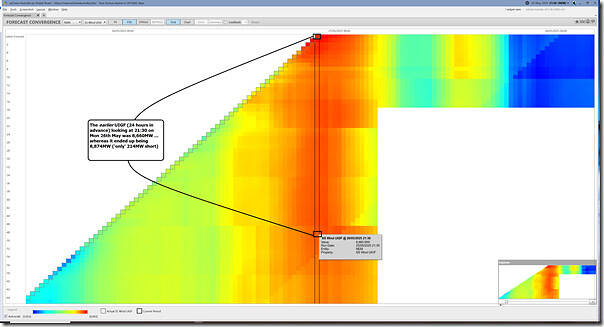
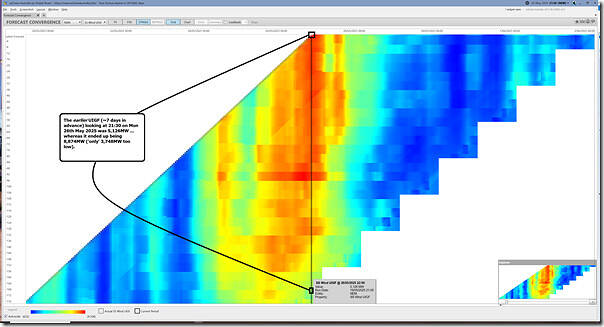
Remembering that the ‘Forecast Convergence’ widget in ez2view is focused on helping clients ‘look up a vertical’ in order ‘to see that other dimension of time’ here are three different views focused on the same peak wind record that help provide a more rounded view:
Some key data point results
Before we move on, let’s restate a couple key data points relevant to the new peak wind record:
-
- At 21:35 we have:
- FinalMW of 9,287MW (68% instantaneous capacity factor) across both Semi-Scheduled (8,746MW or 68%) and Non-Scheduled (541MW or 60%) capacity … notwithstanding complexities noted here.
- Specifically for just the Semi-Scheduled units:
- Availability (feeding into NEMDE, noting this process) was 8,893MW and Target was 8,765MW … so the difference (128MW) is the calculated curtailment
- But also worth noting that Availability (at 8,893MW) was 168MW lower than UIGF … meaning one or more Wind Farms presumably used MaxAvail to limit their availability further:
- which can now happen post August 2023.
- with the specific reasons not explored yet
- Also worth noting was that at 21:30 (nearest half hour to 21:30):
- the UIGF was 8,874MW (see this below); and
- Availability was 8,843MW
- Meaning 143MW lower, presumably because of some plant physical reasons.
- At 21:35 we have:
Viewpoint #1) Looking an hour ahead
If we’re only looking an hour ahead, we can time-travel backwards to 21:35 on Monday 26th May 2025 and use the ‘P5’ predispatch dimension of data:
In this view, we’re seeing that, about an hour ahead, the forecast was 335MW higher than it turned out to be (i.e. an ‘error’ of 3.7% )
… though readers should remember that this was probably not uniformly spread across all Wind Farms!
Viewpoint #2) Looking a day ahead
Flipping to the ‘P30’ predispatch data set, we have to move the clock forward to 21:30 because of the shortcomings of Tripwire #1 (and vagaries of Tripwire #2) and we see the following:
In this case, the forecast was 214MW lower than it turned out to be (i.e. an ‘error’ of 2.4% )
… though readers should remember that this was probably not uniformly spread across all Wind Farms
Viewpoint #3) Looking a week ahead
Flipping to the ‘STPASA’ data set (and again with the clock at 21:30) we see the following:
In this case, the forecast was 3,748MW lower than it turned out to be (i.e. an ‘error’ of 42% )
… though readers should remember that this was probably not uniformly spread across all Wind Farms
So, in response to the question at the top of the page, the answer is perhaps best summed up as ‘It depends!’ … with important considerations being:
- how long in advance; and
- how accurate did the forecast need to be?
- Remembering, of course, that this was a single instant in time – and it’s more than this that counts.


Be the first to comment on "Was Monday evening’s new record wind production well forecast in advance?"