
In 2025 we will see the introduction of frequency performance payments and changes to how regulation FCAS costs are recovered, key components of the reform to incentivise primary frequency response in the NEM.
To provide context for understanding the upcoming impacts of the reform we present historical trends of prices and enablement levels for frequency regulation services.
The current services
Regulation raise (RAISEREG) and regulation lower (LOWERREG) are the two market FCASs used to control frequency within the normal operating band.
We review the raise service first, followed by the lower service, and we cover enablement (MW) and price ($/MWh).
On regulation services
Detail on the what and why of FCAS – frequency control and ancillary services – can be found in About System Frequency.
We focus on the regulation services because these are impacted by the reform.
Regulation Raise (RAISEREG)
Regulation Raise Enablement
The enablement is the MW amount.
The requirement (required level of enablement) is set at the individual constraint level, which may (and typically does) address needs across more than one Region at a time.
Dispatch enablement is a 5-minute value so we’ve summarised each day into a min, median and max value.
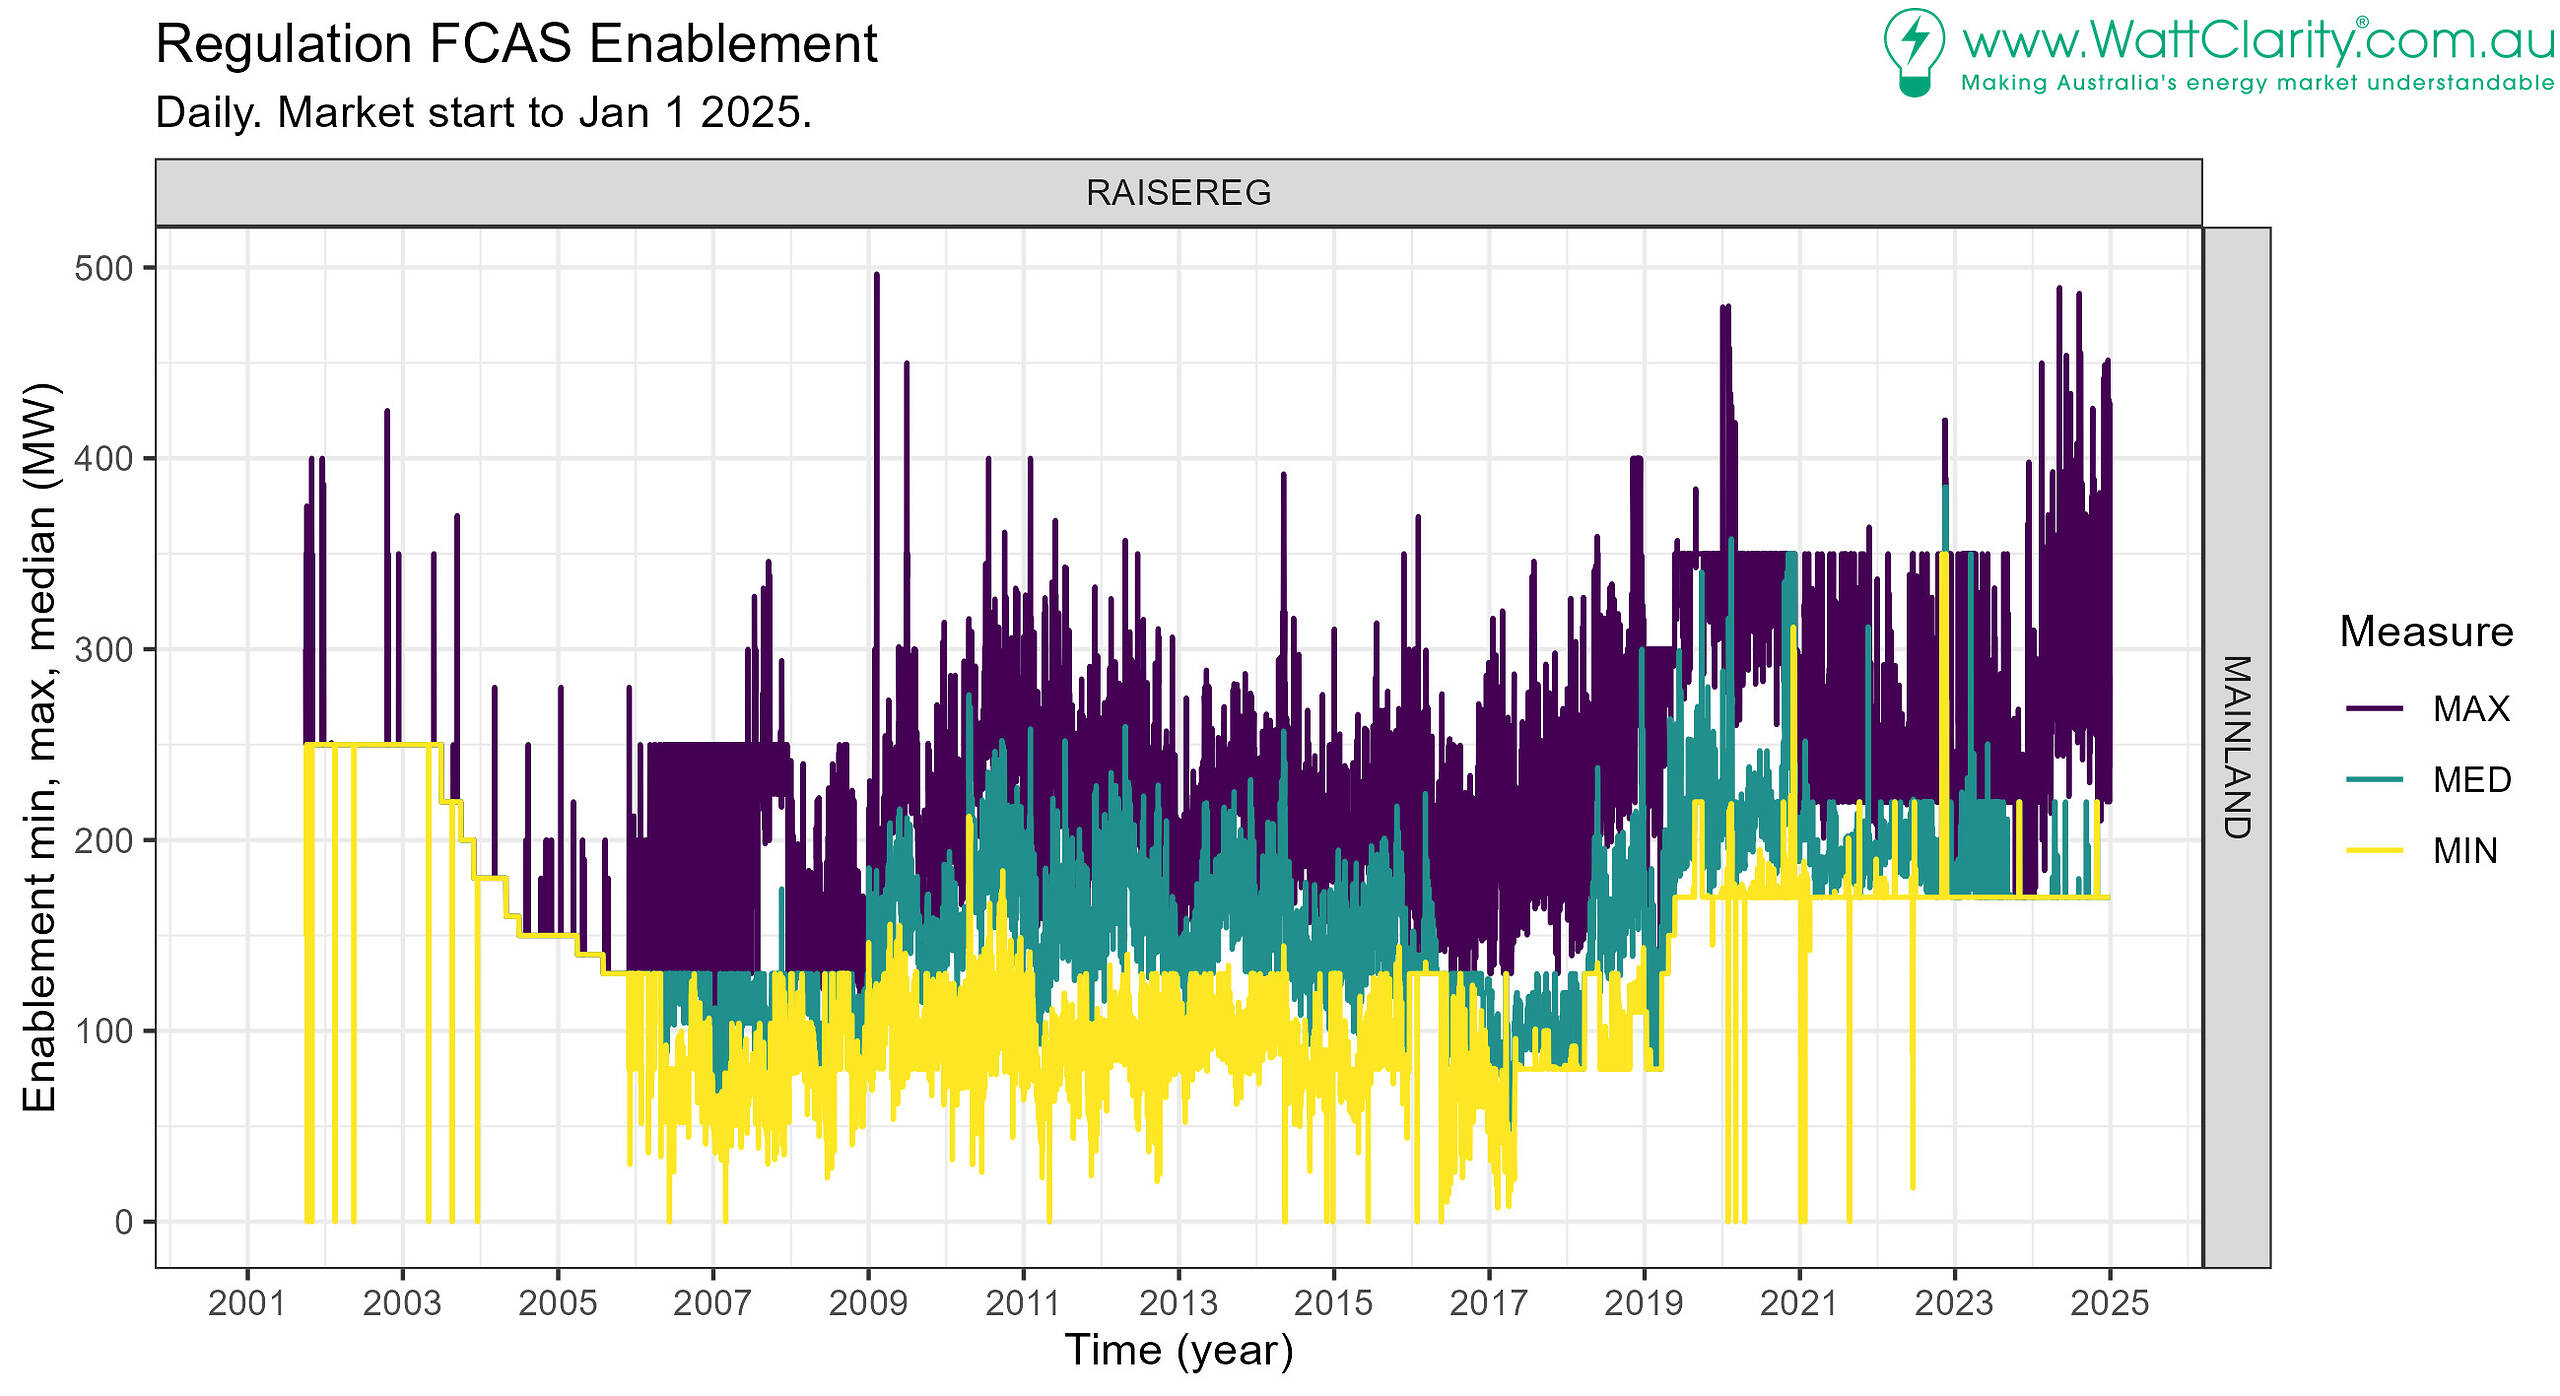
Starting with Mainland enablement levels we observe:
- A stable minimum level of about 170 MW since mid-2019, although some exceptions occur.
- Maximums tended to be generally stable between 2019 and 2024, at 350MW.
- In recent times (2024 onwards) levels above 350 MW are enabled on a more-frequent basis.
- Which may be due to local requirements being more frequent.
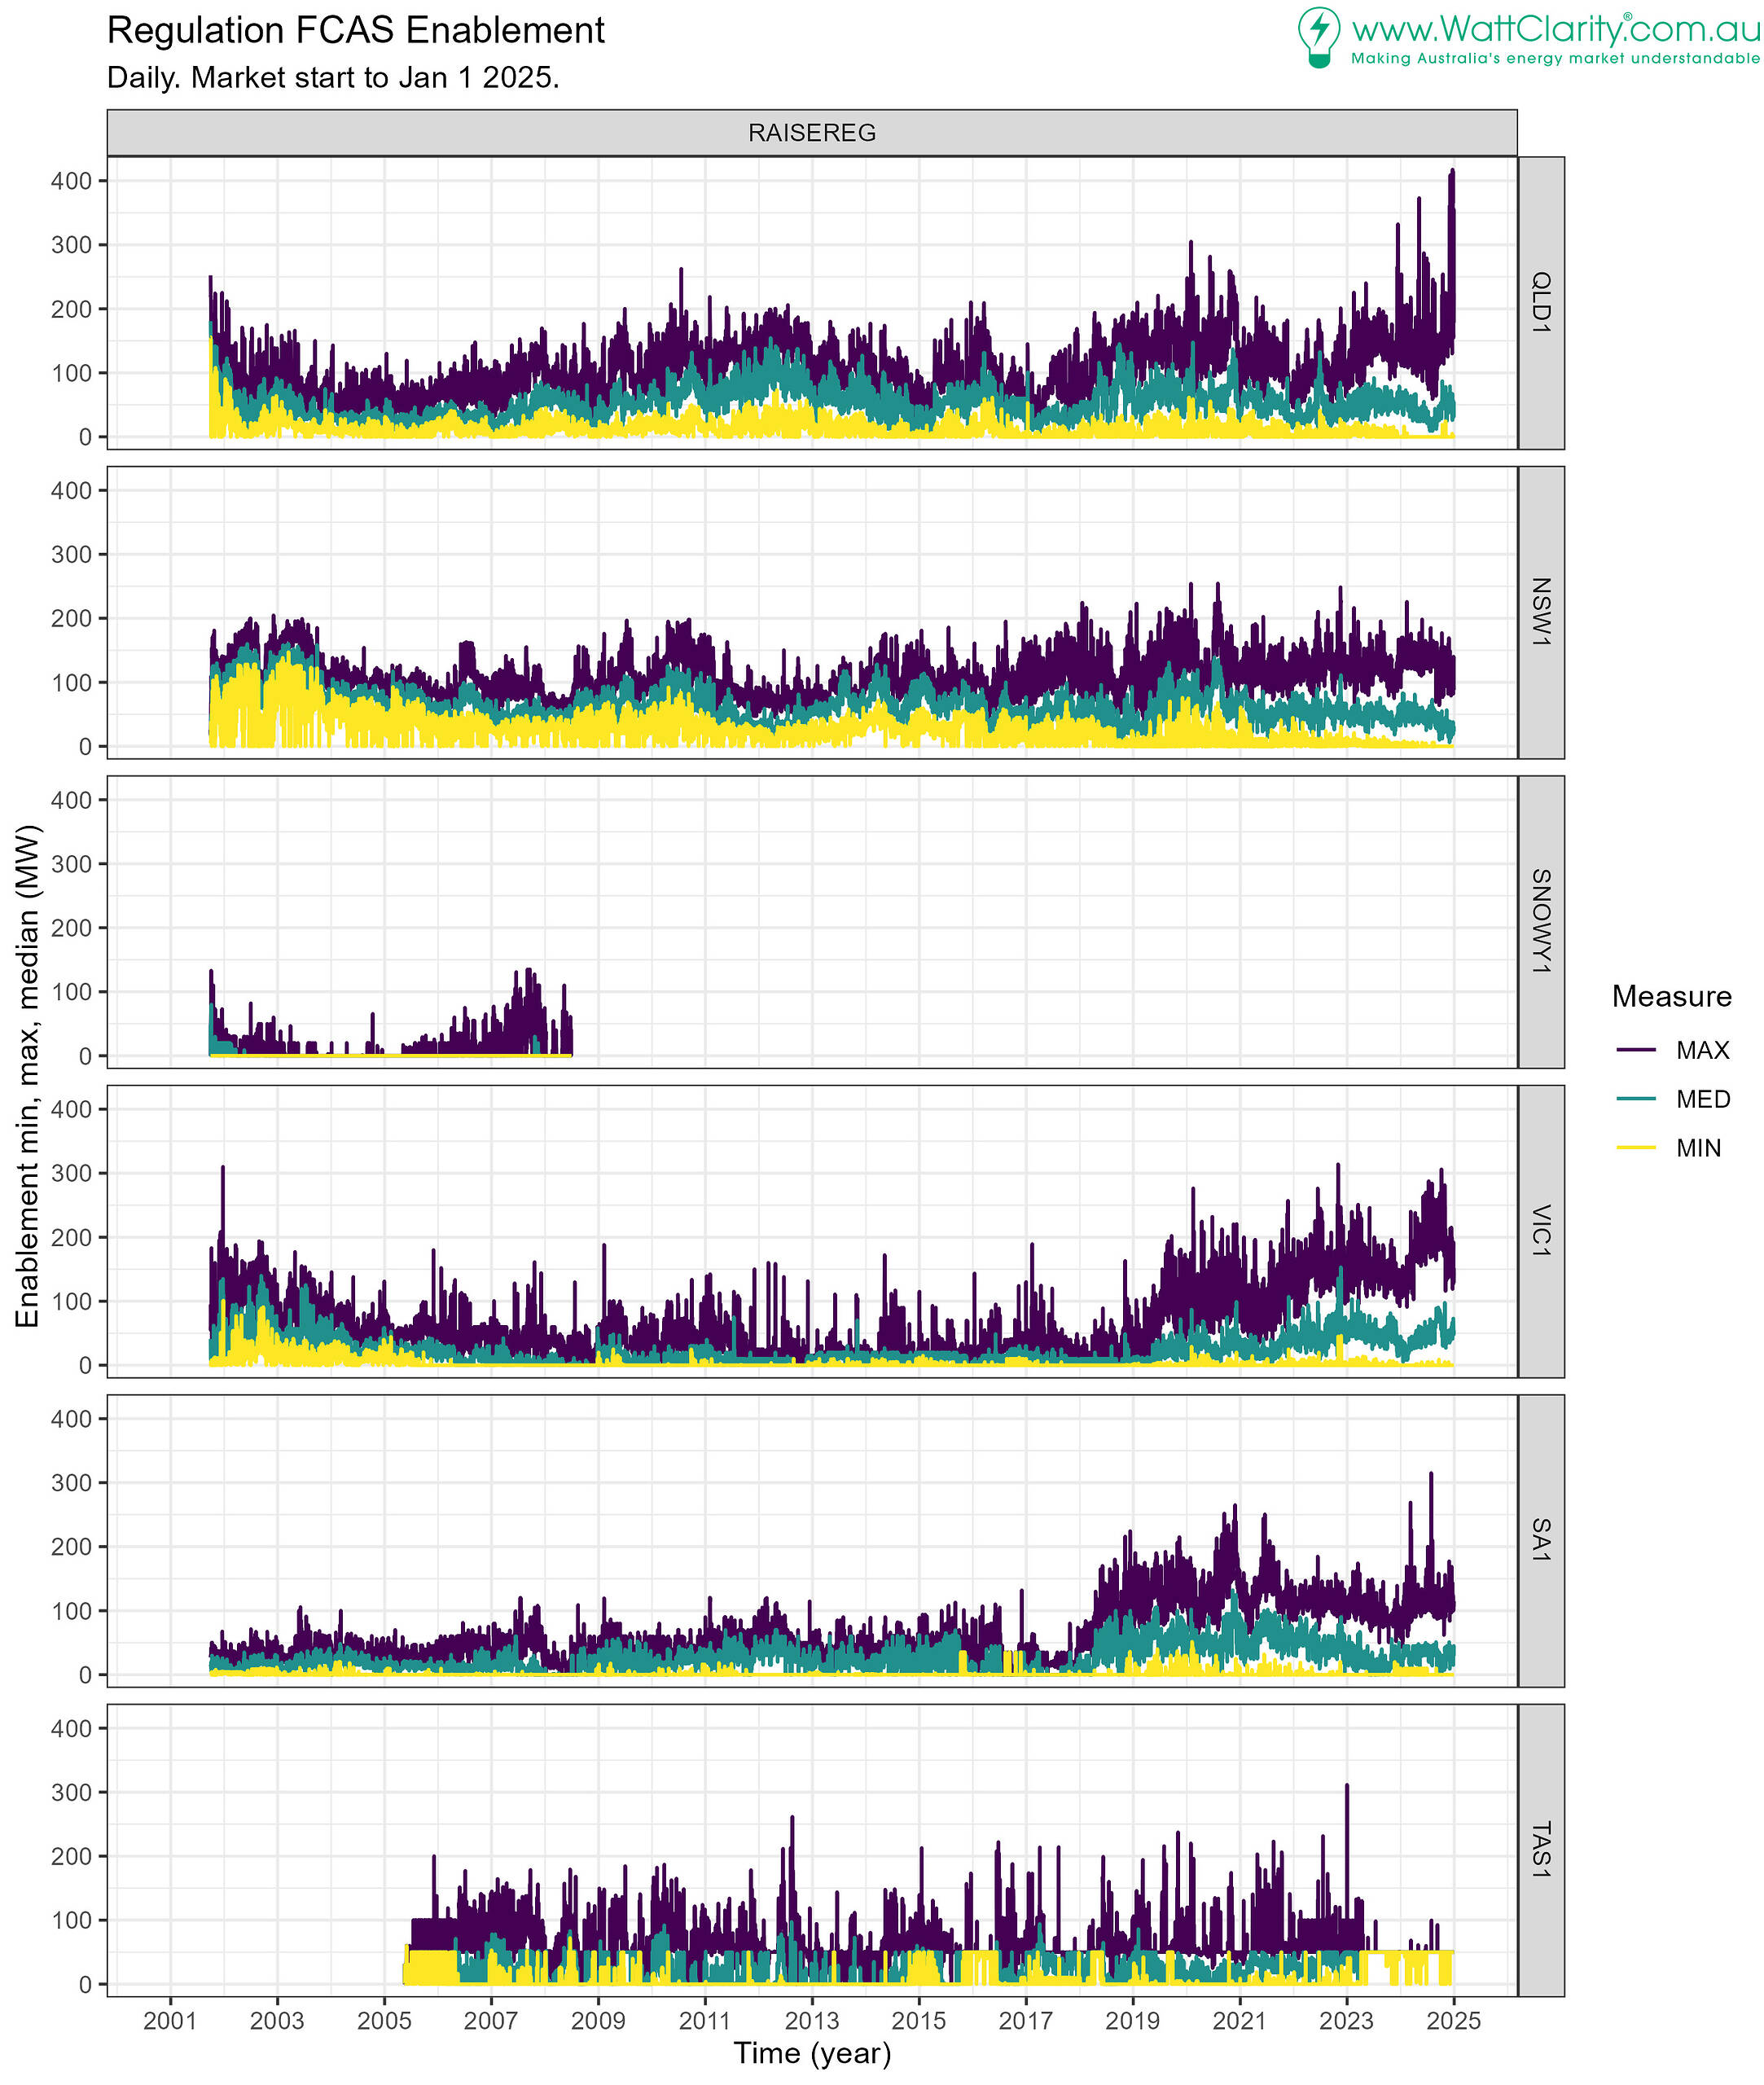
The aggregate enablement from supply-side resources in regions shows which regions make the greatest contribution to provision of each service.
Observations on Regulation Raise enablement levels in Regions:
- QLD1: Occasionally appears to mirror NSW levels.
- QLD1 increased in 2011 while NSW decreased.
- A tendency for high peak enablement levels since 2024, exceeding 400 MW at times.
- NSW1: Since mid-2020 daily medians levels have been less variable, generally below 100 MW.
- SNOWY1 was abolished in 2008.
- VIC1 levels of enablement have been increasing since 2019, particularly maximums.
- SA1 levels increased in 2018, and a tendency for reducing levels follows from 2021 (as indicated by the medians).
- TAS1 levels have been lumpy, a recent ‘flat-line’ at 50 MW from mid-2023 is evident.
- Overall levels don’t appear to have increased with renewables penetration. Note enablement only provides an upper limit on ‘usage’. Analysis of the used regulation services was discussed in Has adding wind and solar upped the need for FCAS in the NEM?
Regulation Raise Prices
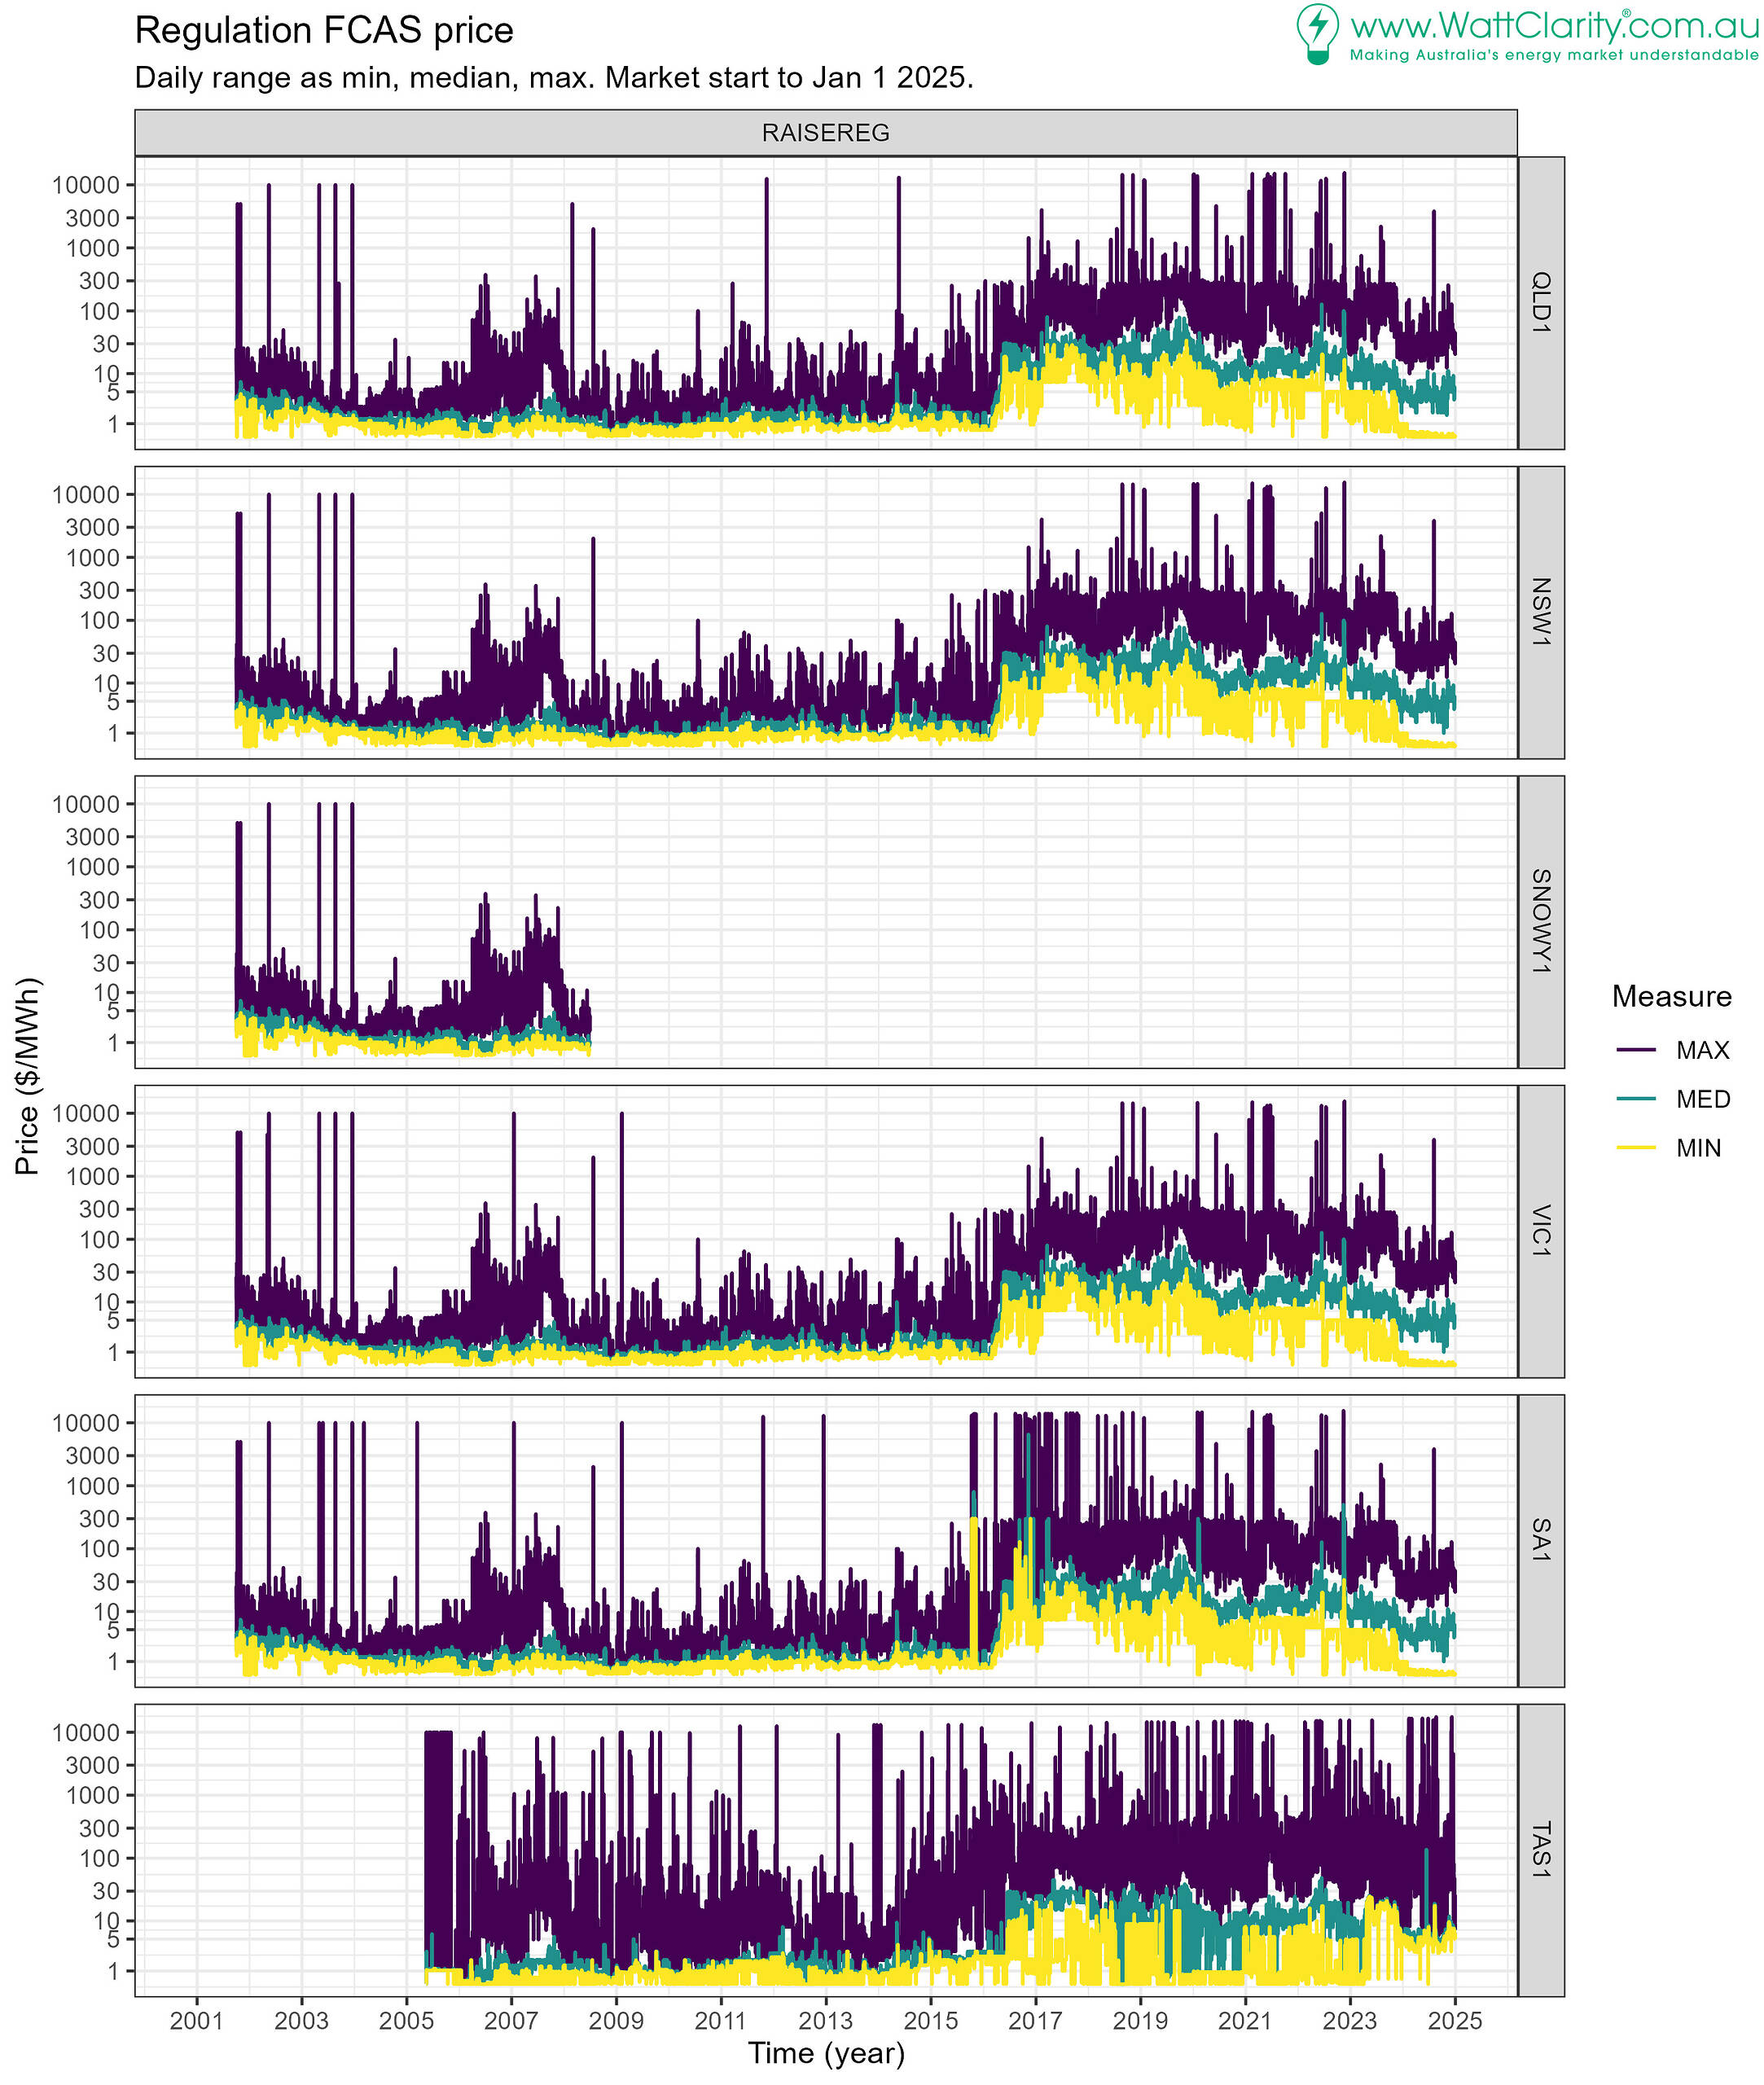
The price is found through summing the cost of each bound FCAS requirement. Each one has a marginal value that represents the cost of fulfilling that requirement.
It’s helpful to get an overview of the regional regulation FCAS prices for their relevance to bidding and, of course, service cost.
Observations on Regulation Raise prices:
- We’ve charted the data on a log scale. This helps to visualise the separation between min, max and median, but needs to be kept in mind when interpreting differences.
- Mainland regions are generally the same, being AC-connected, global regulation requirements can usually meet most normal operating requirements.
- Mainland prices increased by a considerable step-up around 2016.
- SA1 prices late in 2016, and into 2017, saw high volatility. This is indicated by the number of days with maxima at or near the market price cap.
- TAS1 prices see the greatest volatility overall.
- Since late 2023 a step-down in mainland region prices is noticed.
- Minimum prices were frequently at $5 in 2023, yet that price corresponds to median prices in 2024.
- The drop coincides with the introduction of the 1-second contingency markets however the dynamics of any such relationship are not explored here.
Regulation Lower (LOWERREG)
Regulation Lower Enablement
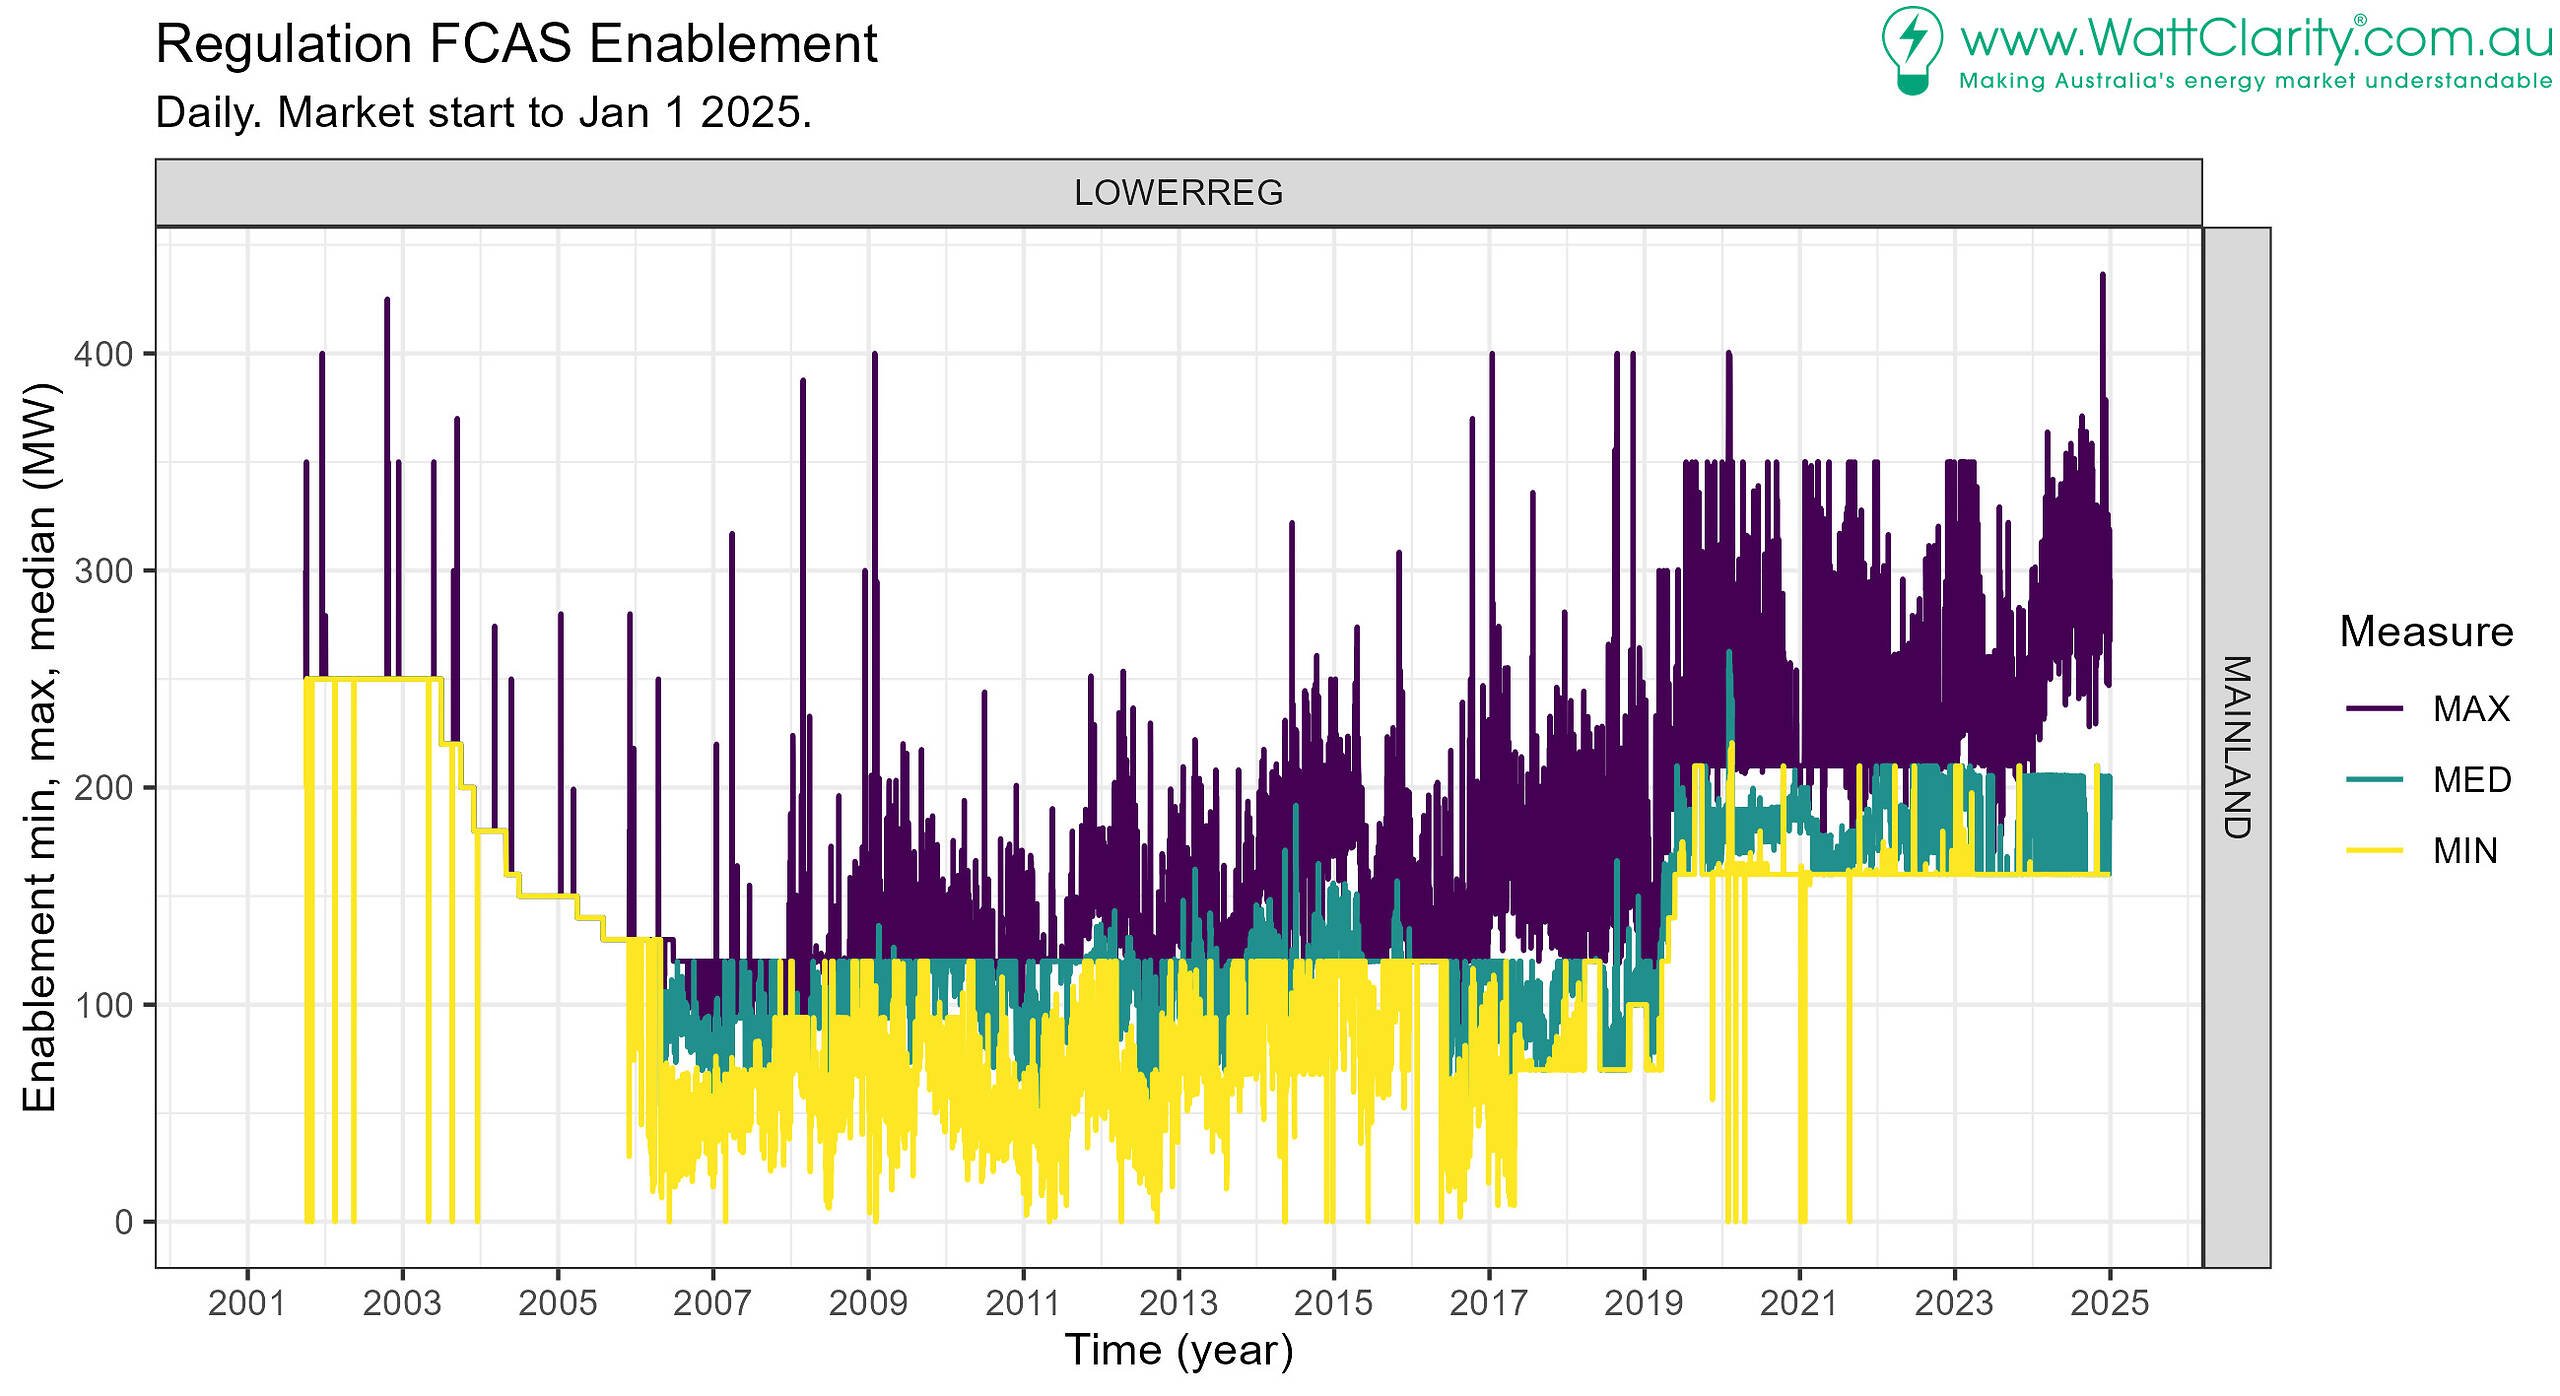
The enablement is the MW amount, set at each dispatch cycle (5-minutes).
For the Mainland:
- Generally steady levels above 150 MW in recent years.
- Minimum levels at just-a-bit over 150MW.
- Median levels between about 150 and 200 MW.
- Maxima at 350 MW, typically.
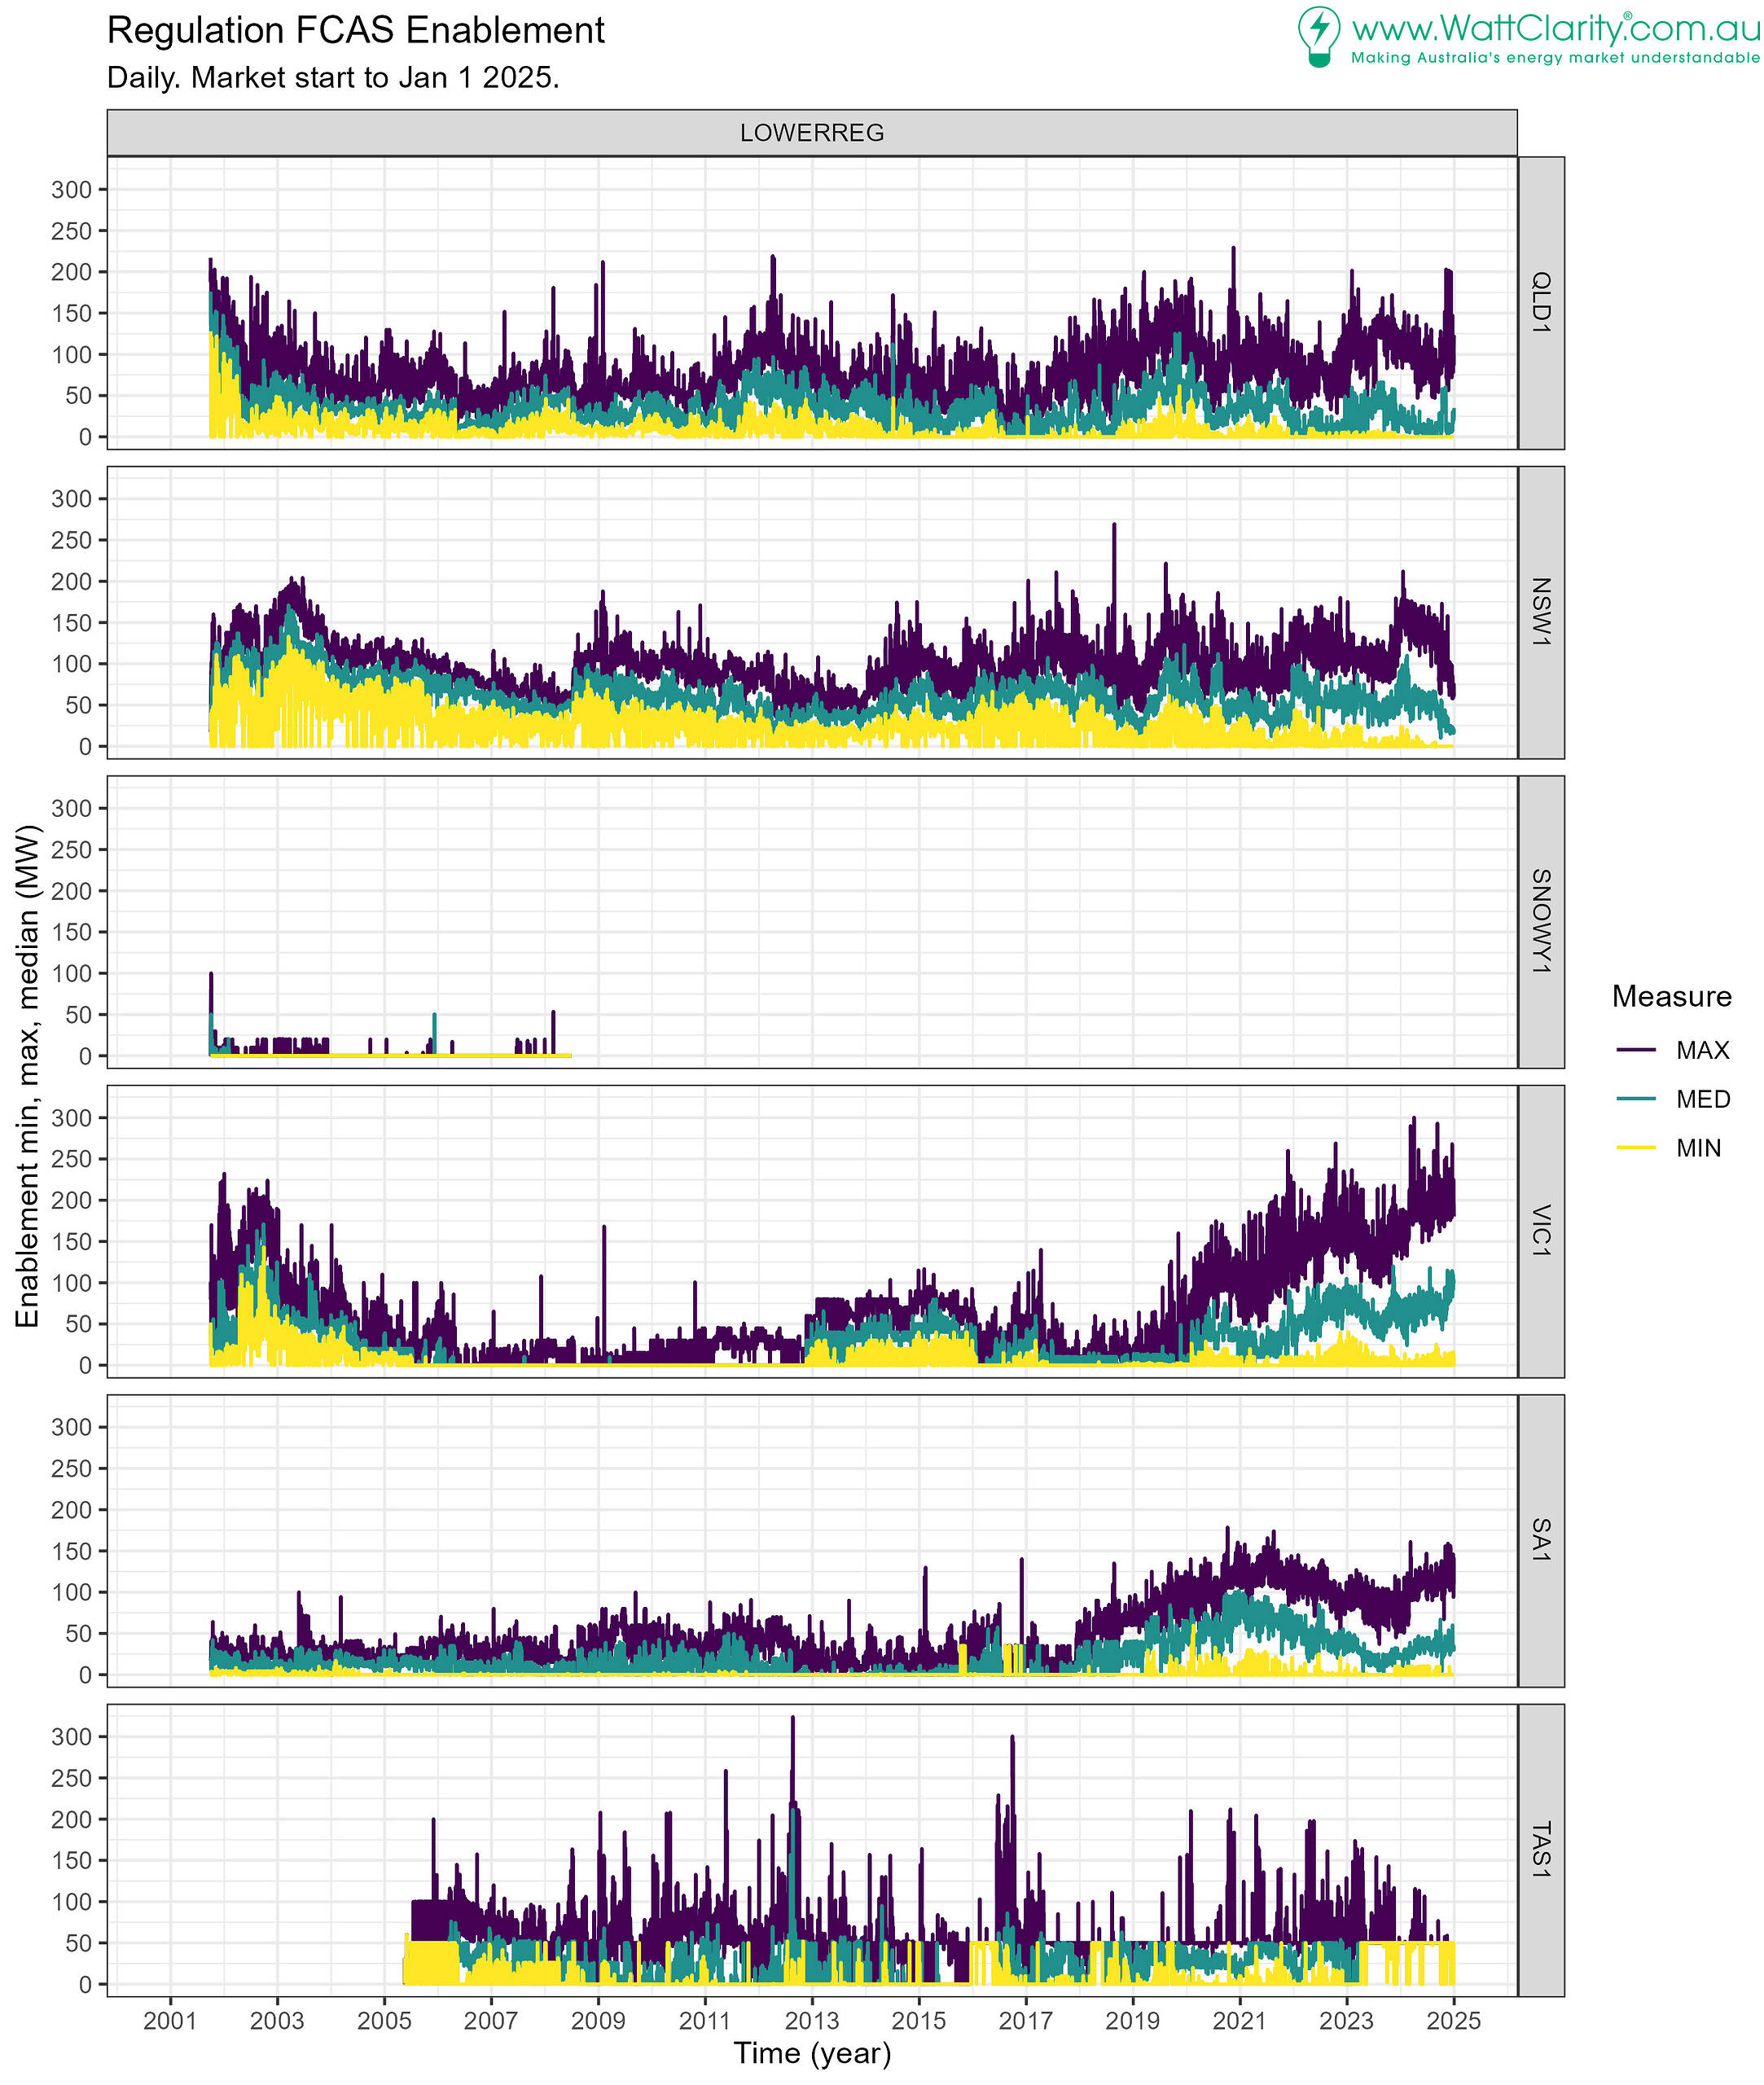
In the chart of Regulation Lower enablement, by region:
- A big lift-off in VIC1 maxima is observed from late 2019.
- Medians followed more gradually.
- Enablement levels in SA1 peaked (based on medians) in 2020, having risen since 2017.
- The 2020 peak subsided by 2023 though levels picked up across 2023 and 2024.
- A greater separation between medians and maxima is observed in NSW1 and QLD1 since 2022, approximately.
- Indicates a more regular occurrence of the daily maximum at a high level each day.
- The separation is even more visible in VIC1 and SA1.
- A persistent minimum level from TAS1 providers is visible in recent years, at 50MW.
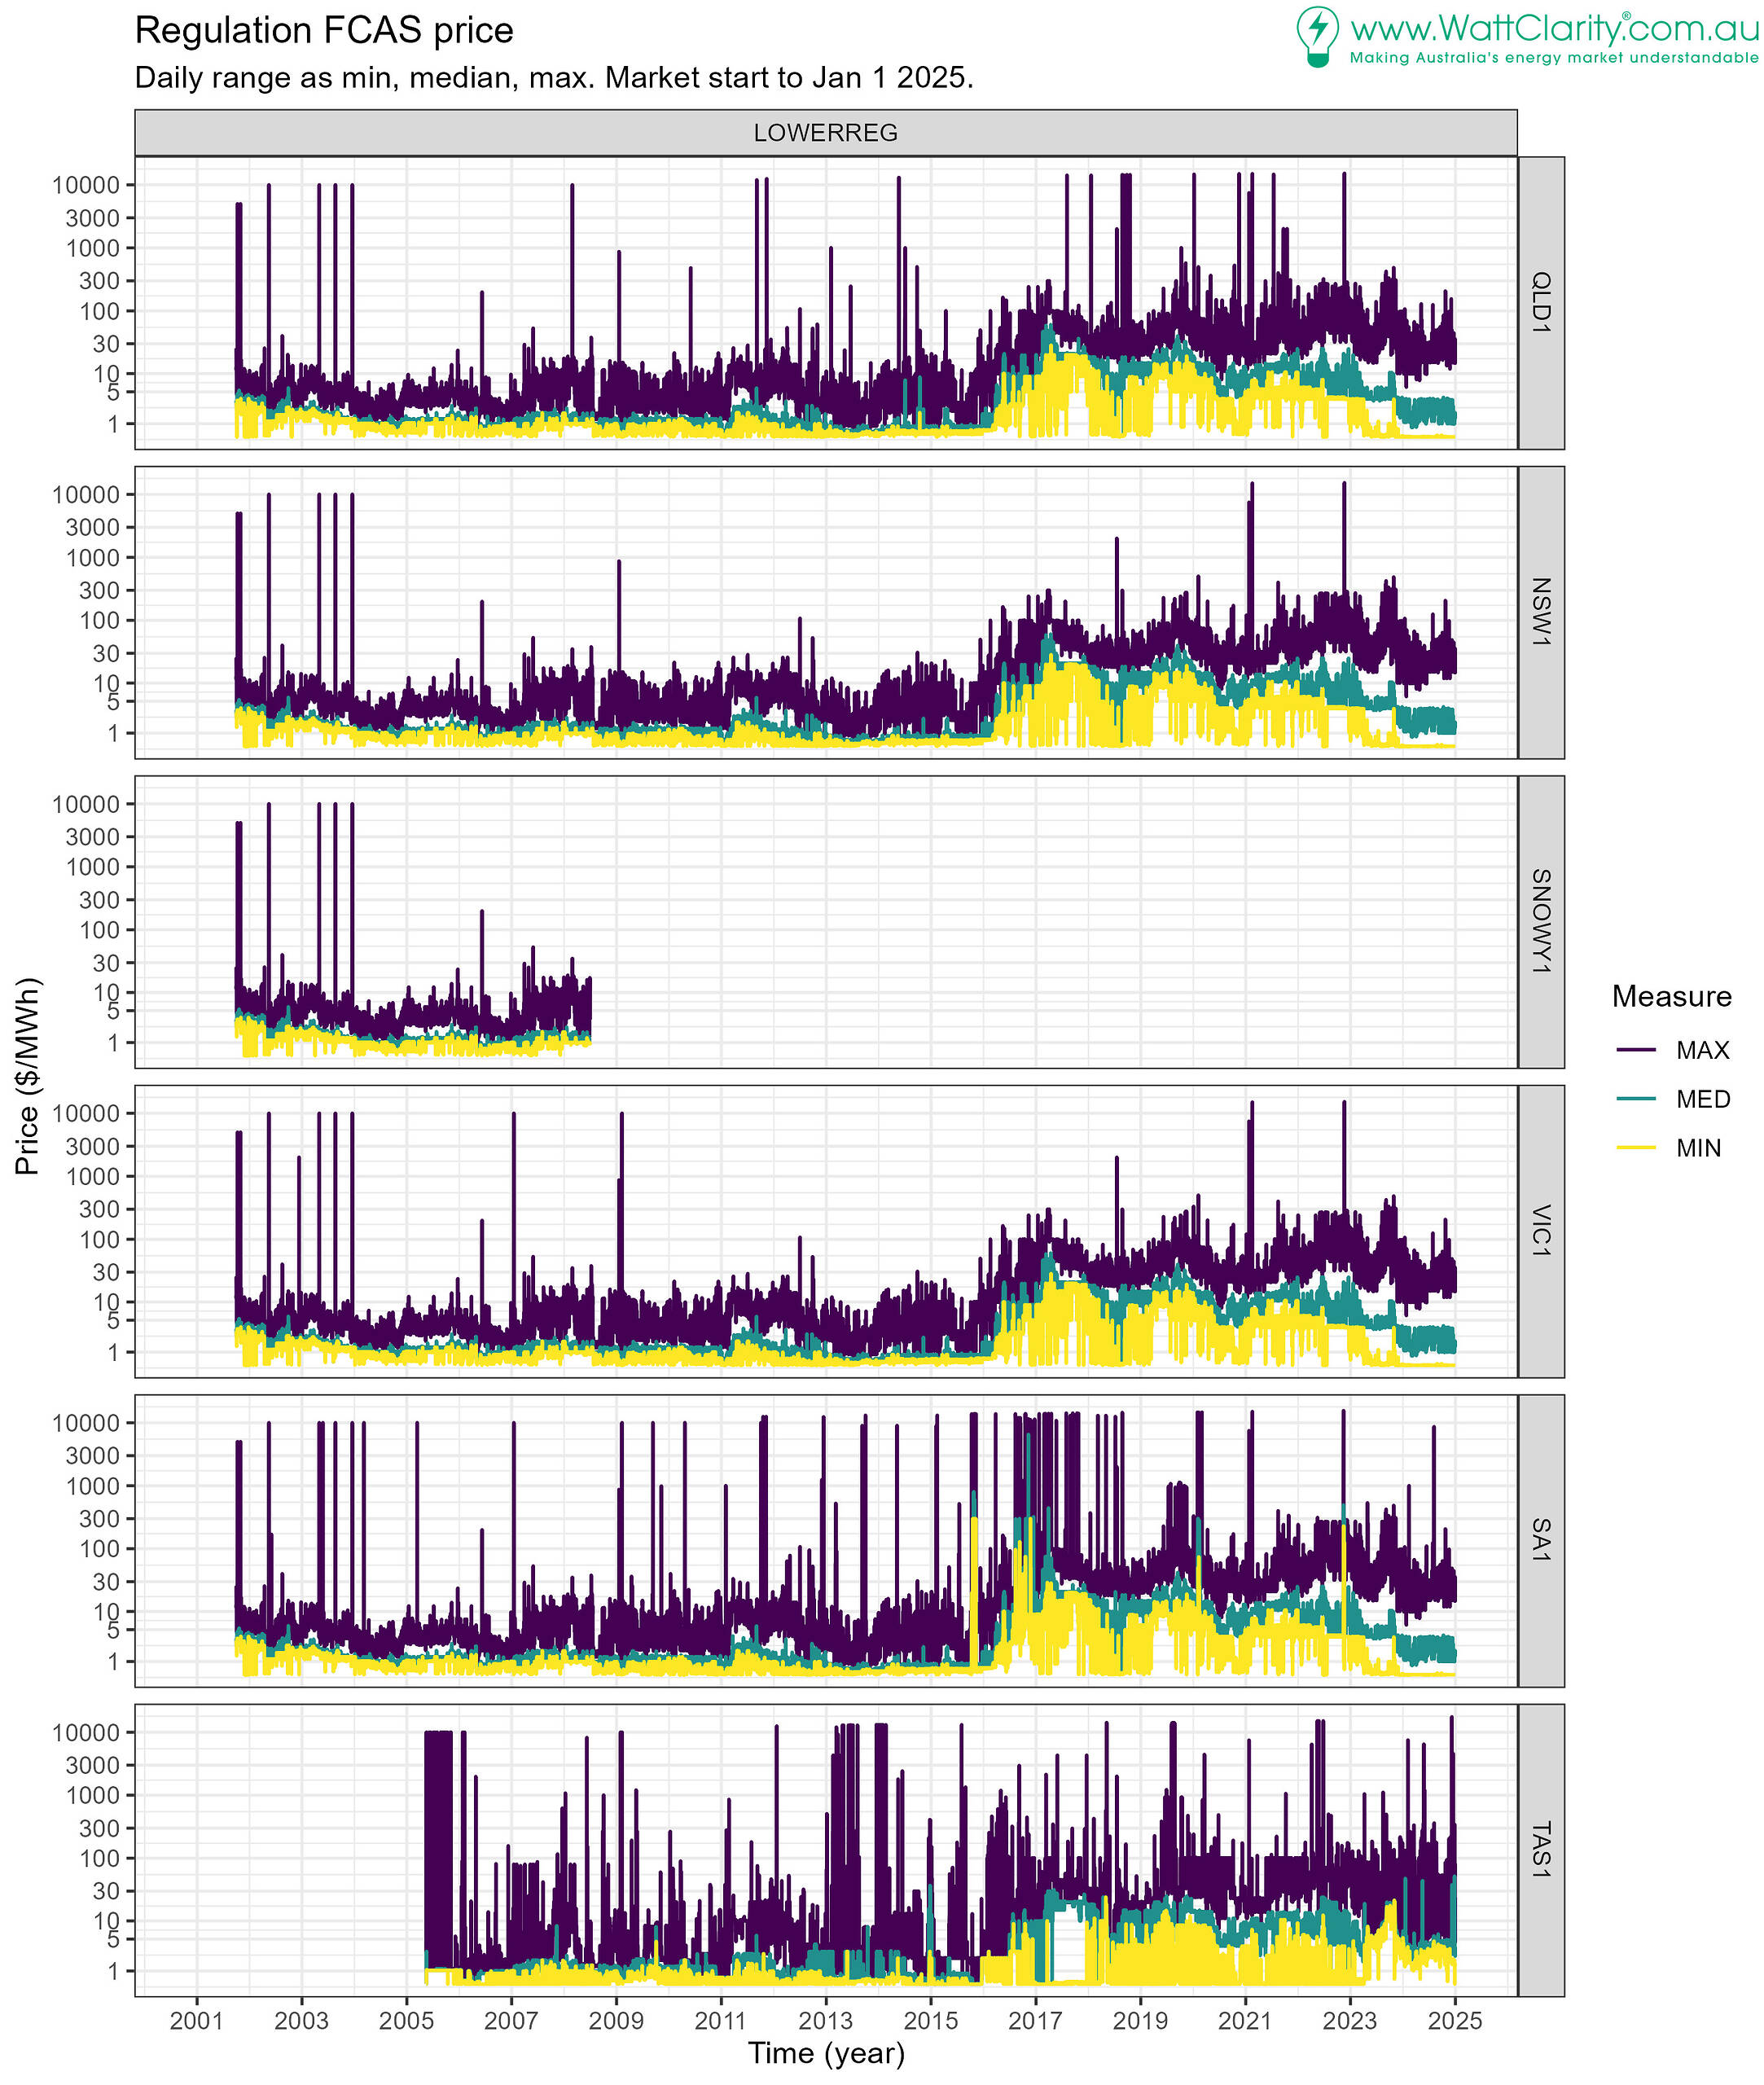
Regulation Lower Price
Observations on Regulation Lower prices:
- As with the raise service’s prices, regulation Lower prices rose across 2016 – 2017.
- Prices in mainland regions have been subdued since late 2023. This is reflected in the low median (and minimum) price levels.
- Maximum daily prices in mainland regions remain elevated, but with less volatility. In 2024 its was rare to see prices higher than $300 outside of SA1.
- In TAS1, there is less variability in the minimum and median price. The range of daily maximums continues to be variable and is now wider than the range seen in years prior to 2024.
Key takeaways
We’ve only scratched the surface of the history of Regulation FCAS in the NEM.
We’ve reviewed the historical series of:
- prices and
- enablement levels
Standing at the start of 2025, the NEM appears to be in a period of low Regulation FCAS prices, relative to prices between 2016 and 2023.
However, 2024 experienced higher peak levels of enablement and a more frequent occurrence of these high levels.
The future
2025 will see the implementation of the reform to incentivise PFR.
This reform changes how Regulation costs are allocated and introduces frequency performance payments (FPP). Even if costs of regulation FCAS remain at 2024 levels (given prices), recovery of frequency performance payments will add to the total cost needing to be recovered from cost recovery participants. This will disrupt the pattern of costs and revenues that participants have become accustomed to in recent years.
Be the first to comment on "Regulation prices and enablement – a historical review"