
Cyclone Alfred passed over the Moreton Islands in the early morning of Saturday the 8th of March. Reports indicate he reached mainland Queensland, just north of Brisbane at 9pm that same day, as tropical low.
Alfred’s location meant impacts were primarily experienced in northern NSW and south-east Queensland. We turn our focus to those parts of the NEM for this review of electricity demand.
Recap on Alfred’s movements
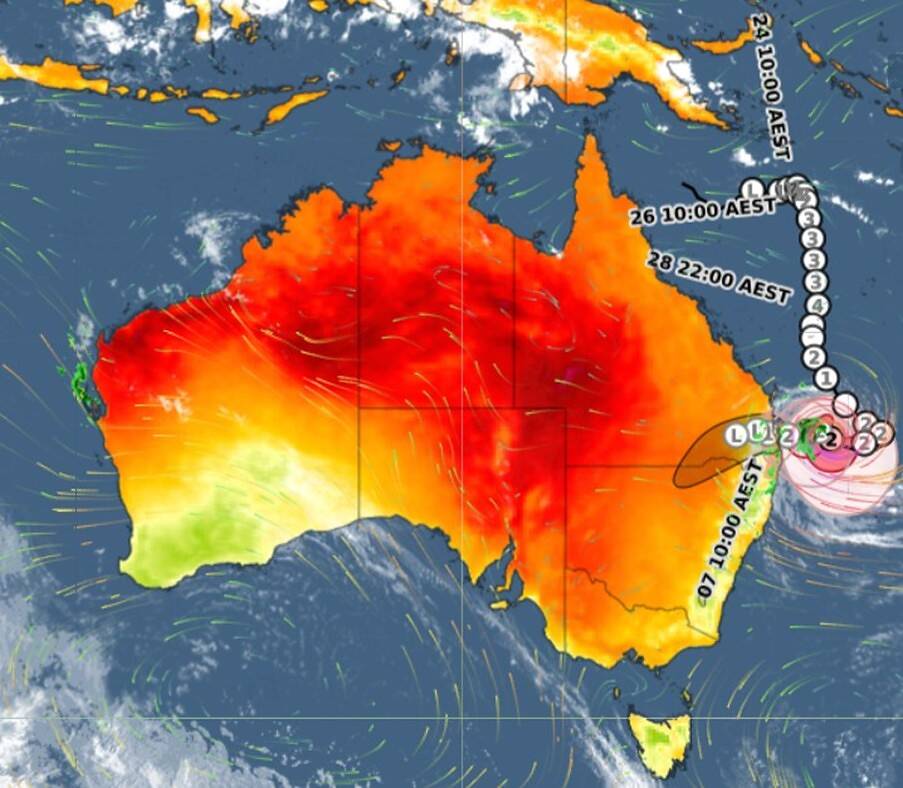
Alfred formed in the Coral Sea, north of Cairns and had moved south to the latitude of south-east Queensland by Monday 3rd March.
Alfred had started a westward trajectory, towards the mainland, by Tuesday the 4th. And that’s when many localities that were forecast to be in his path commenced preparations in earnest.
He had been meandering about off the coast of south-east Queensland for days as a Category 2 cyclone exhibiting gradual movement towards the mainland in line with forecasts for landfall on Friday 7th.
Yet he moved slower than early predictions, landfall was on the 8th. Weatherzone’s article Seven maps that illustrate Tropical Cyclone Alfred from the Wednesday, included the following track of Alfred’s position as of midday Wednesday 5th, and an outlook for landfall on Friday 7th. We now know Alfred persisted a little longer off the coast before making landfall later on the Saturday.
Weatherzone’s article “Seven maps that illustrate Tropical Cyclone Alfred” from Wednesday 5th, included this track of Alfred’s position.
Following landfall on the 8th the Bureau of Meteorology issued this update of Alfred’s path showing the system had been downgraded to a tropical low:
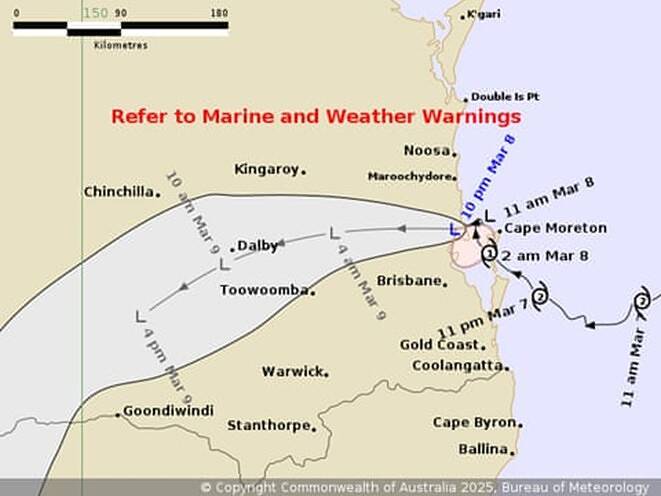
Bureau of Meteorology update late on March 8, 2025
Demand Impacts
The extended wait for Alfred to pass led to a longer period of Alfred-induced weather on localities near the coastline. Extreme winds, cloud cover and heavy rainfall at southern flanks, to name three.
Early preparations (including by the WattClarity team) and the system’s gradual movement meant that impacted communities adjusted activities in the leadup to Saturday.
Numerous locations saw public transport suspended, shops and restaurants closed. Many worked from home if and when they could.
The damaging weather, and rainfall, contributed to widespread power outages.
These demand-side changes, coupled with the weather and network outages resulted in atypical patterns in electricity demand.
7 days before landfall, Saturday March 1
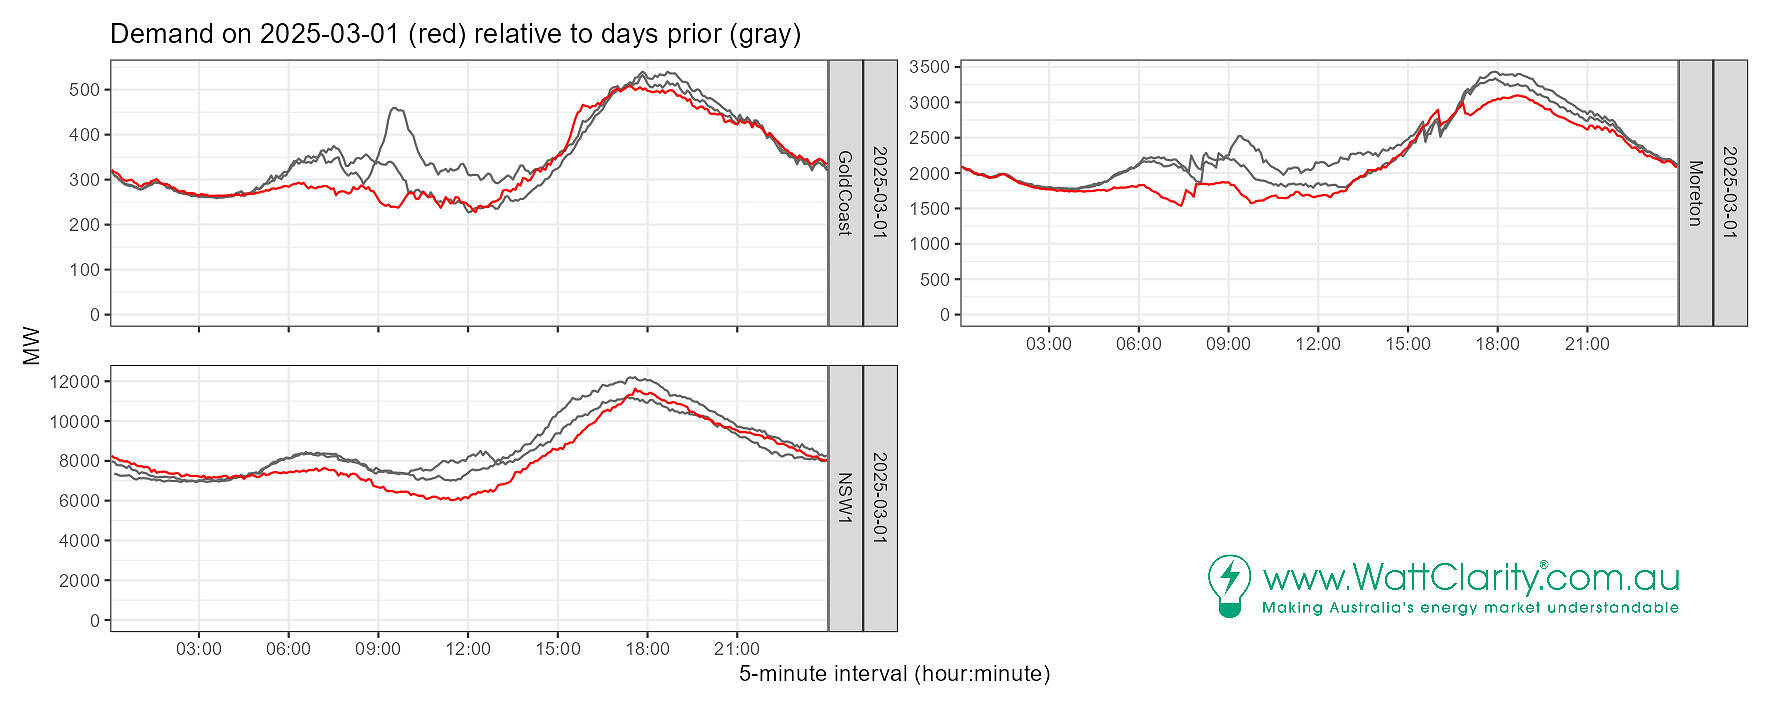
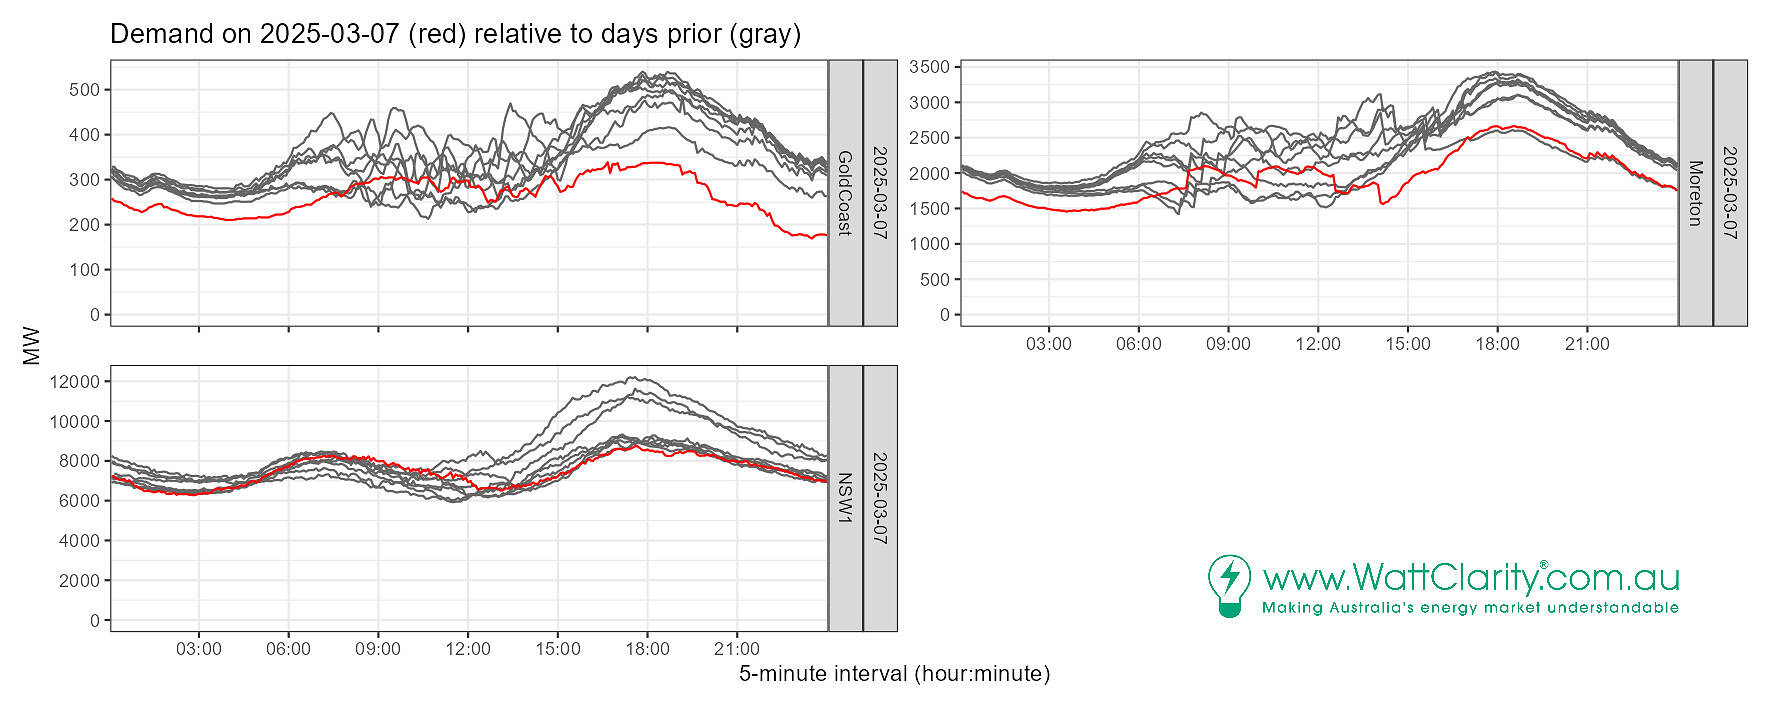
The chart below, and subsequent ones, presents demand levels for three areas:
- Gold Coast area of south-east Queensland
- Moreton area of south-east Queensland, which includes Brisbane
- NSW1, the New South Wales NEM region. No sub-regional datasets that would encompass impacted areas were available at the time of writing.
We can see demand levels overnight were similar to the two previous days, in the three panels.
Midday demand for the Gold Coast on the 1st dipped below the overnight minimum. Attributed to ‘behind the meter’ supply from rooftop PV (only light cloud was present) and the day being a Saturday meaning lighter daytime demand in general. This feature of low daytime demand was also seen in NSW1 and in the Moreton region of Queensland too.
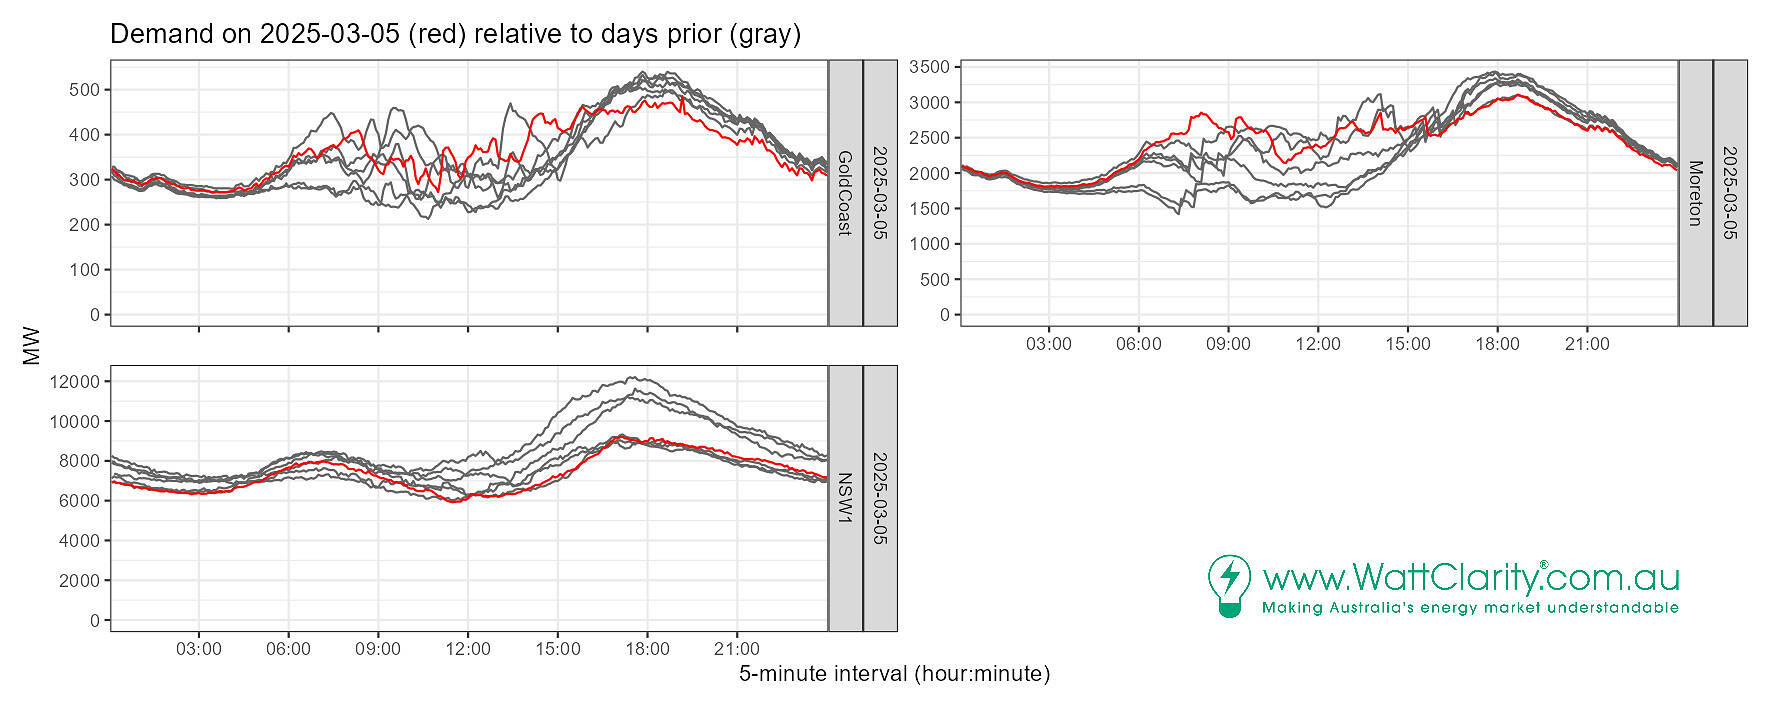
3 days before landfall, Wednesday March 5
Overnight demand levels for Moreton and Gold Coast were remaining in line with typical levels, as indicated by the red line being close to prior days. Midday demand levels varied, and tended to be relatively high. Rooftop PV output was reduced by extensive cloud cover on the 5th.
Generally low demand levels were observed in NSW1 on the 5th. One contributing factor was the cooler east-southeasterly airstream over much of NSW bringing cooler conditions and some rain to coastal regions, yet with it humidity. This was an influence of Alfred being positioned off the coast, north of NSW.
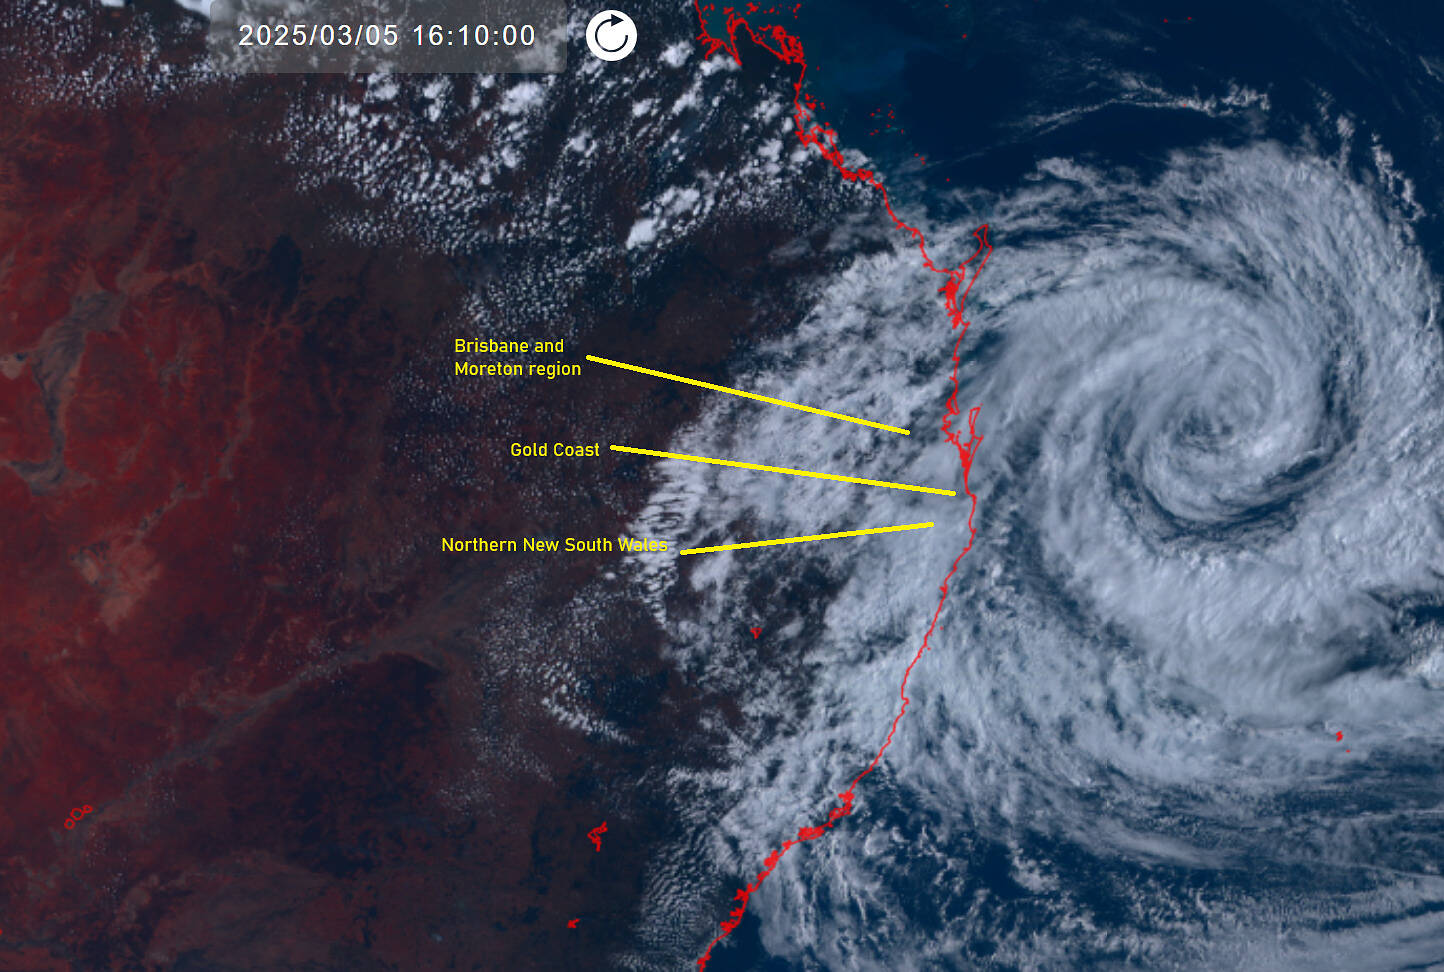
Himawari satellite image from the 5th March
1 days before landfall, Friday March 7
Low demand levels are most evident in the Moreton and Gold Coast charts of Friday the 7th.
The 7th was the first day where power outages became widespread.
Actually, keen eyes will note that low demand levels began the day prior, on the 6th, as evidenced by the lowest grey line at day-end aligning with the demand level of the start of the 7th.
By day-end on the 7th demand levels were down more than 40% in the Gold Coast. Peak demand on the 7th in the Gold Coast was at the typical midnight level, worn at least 200 MW out of 500MW.
The Moreton region, by day-end on the 7th was down about 25%. Peak demand during the day was also very low, down nearly 1000 MW from levels seen on the 1st of the month, and again close to 25%.
Afternoon demand levels in NSW were at reduced levels, but difficult to distinguish from prior days back to the 2nd.
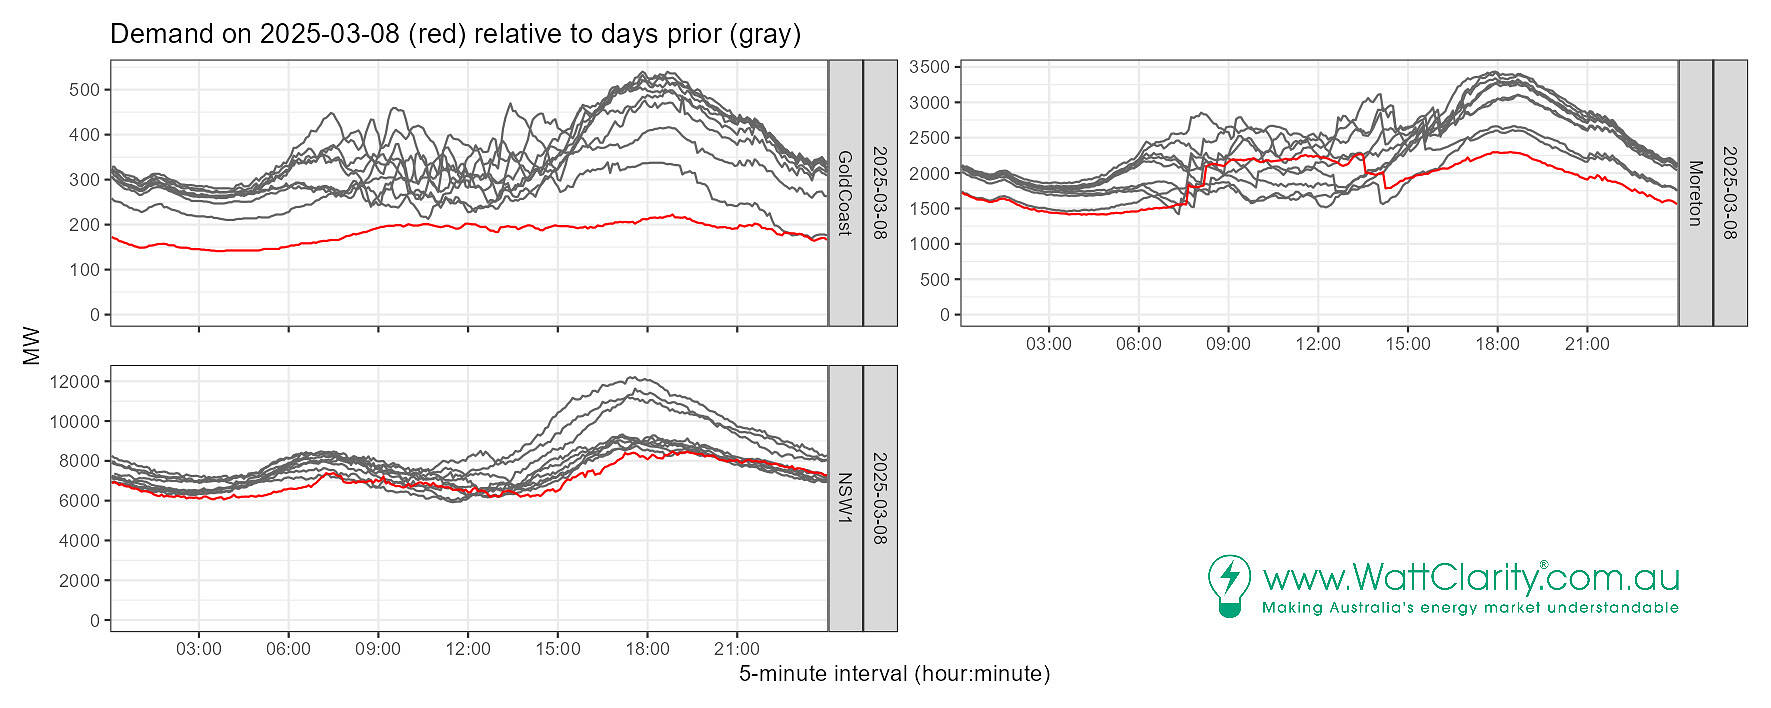
0 days before landfall, Saturday March 8
Saturday the 8th. A quickly growing list of network outages was being communicated to customers through Energex and Essential Energy network outage trackers.
Almost no diurnal variability is observed in the Gold Coast demand panel.
Inspecting just before 18:00 in the Gold Coast panel we note demand at 200 MW. Relative to peak demand on the 1st (500 MW at the same time), the 200 MW level represents a reduction of 60%.
The 8th experienced the lowest 18:00 demand level of the Moreton area in the 8-day series we’ve evaluated.
A step up in demand from around 08:00 to 14:00 roughly, 500 MW, is apparent and attributed to the Wivenhoe hydro pumps consuming electricity.
The early morning minimum dipped below 1500MW. The prior Saturday, the 1st, saw the minimum level at 1750 MW for the same time, – a reduction of 14% therefore.
NSW demand was low but impacted localities represented a smaller fraction of the demand total, so reductions are less-clearly evident in the chart for NSW1, relative to Gold Coast and Moreton areas.
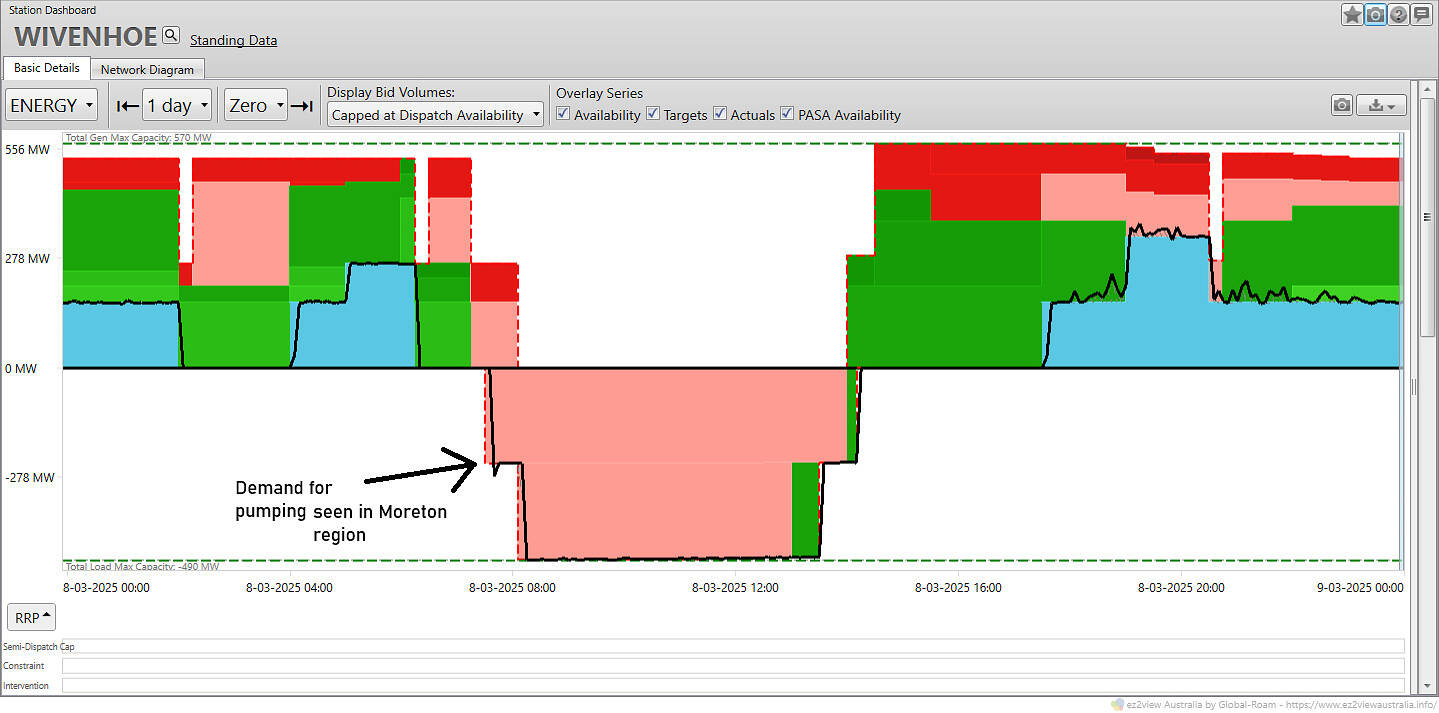
ez2view’s Station Dashboard showing consumption a Wivenhoe power station, explaining a demand increase in the Moreton area.
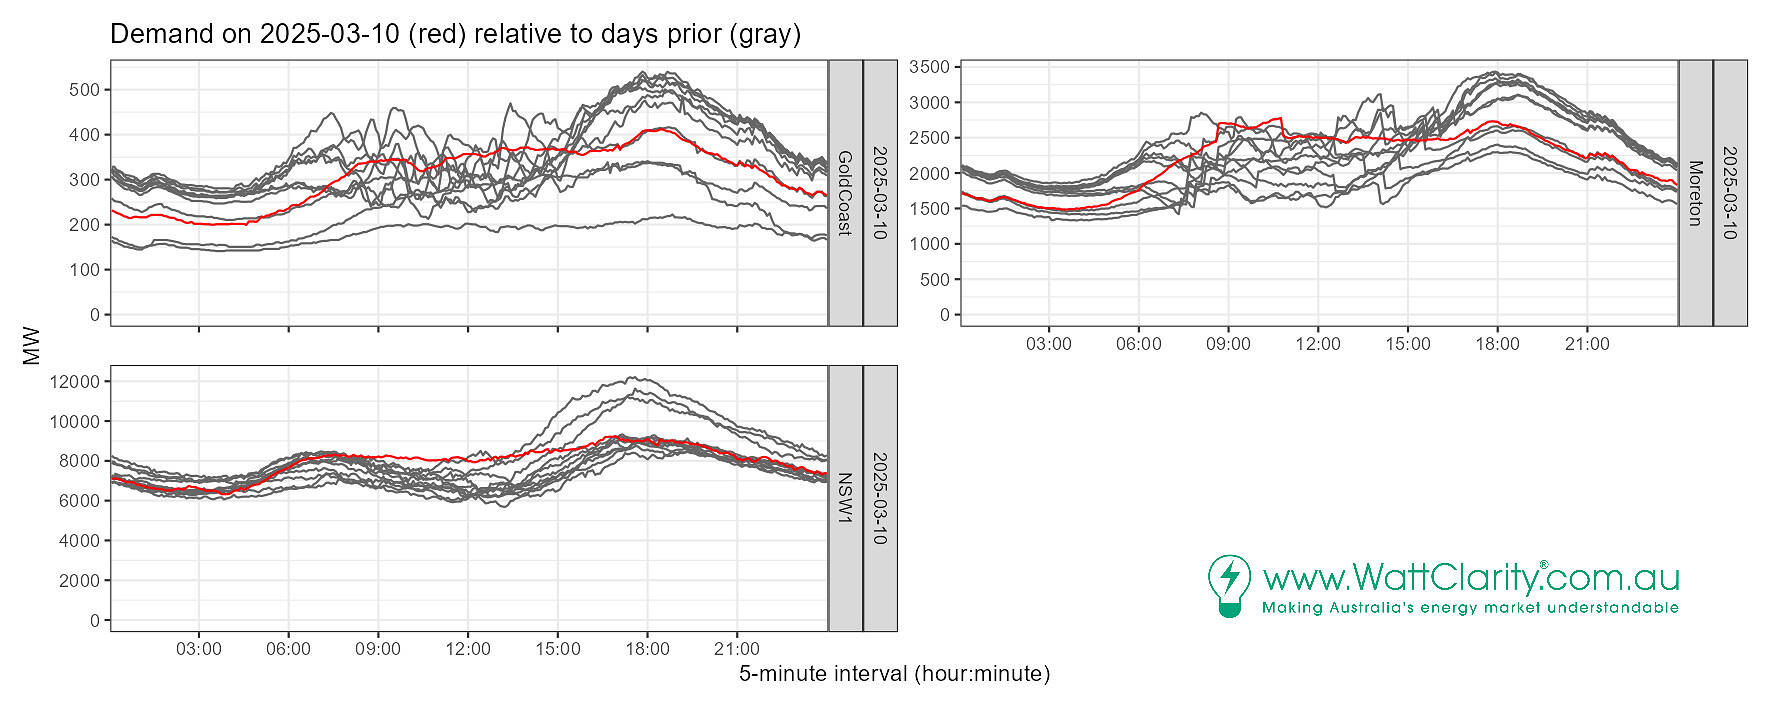
Aftermath, 2 days after landfall, Monday March 10
Cloud cover was widespread still, associated with the left-overs of Alfred following his downgrade to a tropical low as he made landfall. Higher midday levels are attributed to reduced rooftop PV output, due to the cloud, in all three panels of the chart below.
Demand levels for Gold Coast and Moreton, lower relative levels at both ends of the day, indicate demand had only partially returned by the end of Monday the 10th.
By this date, many municipalities had begun moving from disaster management to recovery. Moreton Bay City Council noted that some people were still without power but that rainfall was reducing.
Postscript
As of Friday the 14th drawn out impacts from unplanned outages were still lingering. Unplanned outages still remained in south-east Queensland (including around Caloundra, Ipswich, Brisbane and Gold Coast) and northern NSW (generally in the coastal vicinities, stretching south from Tweed Heads to Byron Bay).
Be the first to comment on "How did Cyclone Alfred impact electricity demand?"