
Back in December, Dan reported on the 19 successful projects in the first round of the national Capacity Investment Scheme (CIS), noting Standalone solar and wind dominate list of 19 successful projects from latest CIS tender.
Yet, anecdotal reports (and many announced projects) indicate many proponents are now incorporating battery storage systems with new solar generation assets. A key reason for adding a battery is to make better use of (to earn more from) generation that would otherwise be spilled during the low-priced periods that are now prevalent across midday hours in the NEM.
This article focuses on solar farms, because these resources are most most impacted by low midday prices because of the time-of-day generation profile. We use the 2024 edition of the Generator Statistical Digest to consider how the new stand-alone solar CIS projects might fare once built.
The projects are:
- Sandy Creek Solar Farm (NSW)
- Goulburn River Solar Farm (NSW)
- Mokoan Solar Farm (VIC)
- Campbells Forest Solar Farm (VIC)
- Hopeland Solar Farm (QLD)
We study existing geographically proximate solar farms to consider potential performance.
Sandy Creek Solar Farm and Goulburn River Solar Farm are close to Beryl SF, *may also include batteries
*Interestingly, the EIS indicates Sandy Creek Solar Farm will also include a 700 MW BESS (2,800 MWh), although that appears not to be included as part of the CIS award. The solar farm is expected to connect into the proposed Elong Elong Hub (330kV) which is one of the two main hubs to concentrate renewable energy in the Central West Orana REZ.
The Goulburn River Solar farm will include a substation and connection to the existing 500 kilovolt (kV) transmission line that runs past the site (eastwards towards Bayswater PS and Newcastle). Its EIS of 2023 indicates the Goulburn River Solar Farm project is also proposing a battery at 280 MW / 570 MWh.
Seeking indications of possible performance we select Beryl Solar Farm.
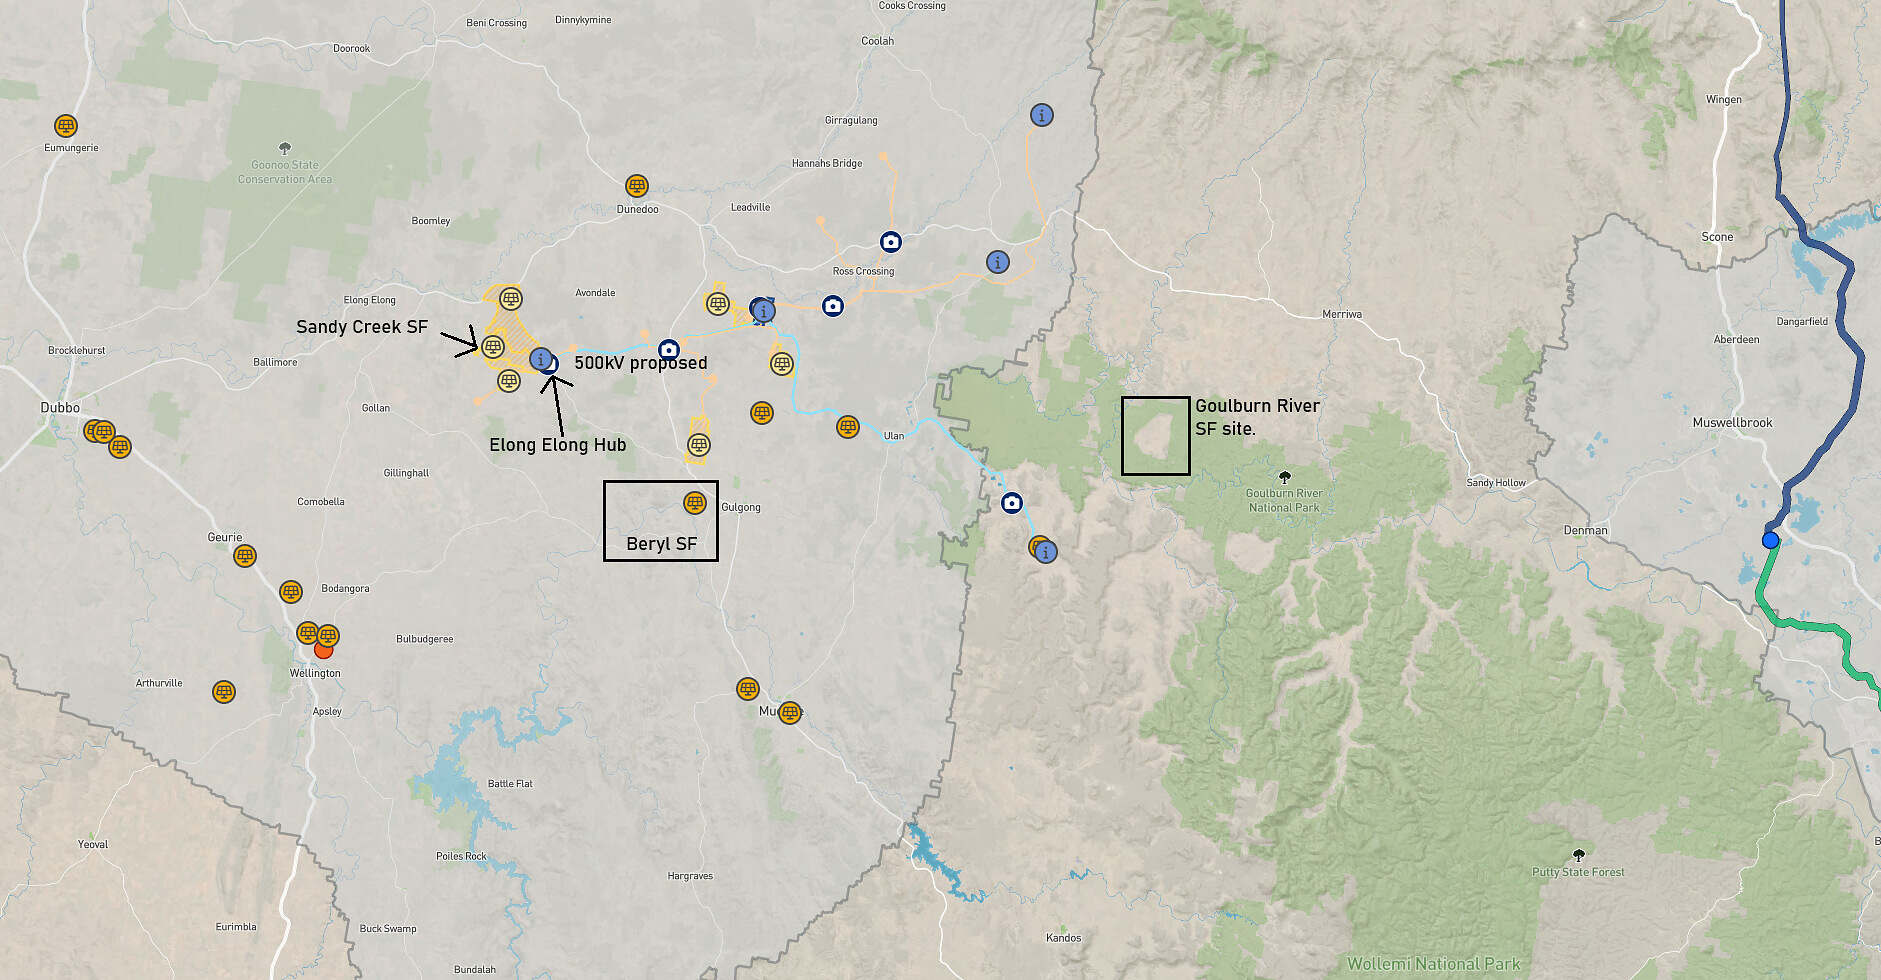
Map of NSW solar sites, annotated. Map courtesy of EnergyCo’s Interactive Map which presents all projects, existing and proposed.
Beryl Solar Farm has seen steady annual capacity factors over the last 6 years between 22% and 25%. In the following capture from GSD2024 we can see the monthly capacity factors in 2024 ranged between 13% and 35%.
The solar farm accessed a volume-weighted average price of 64 $/MWh in 2024.
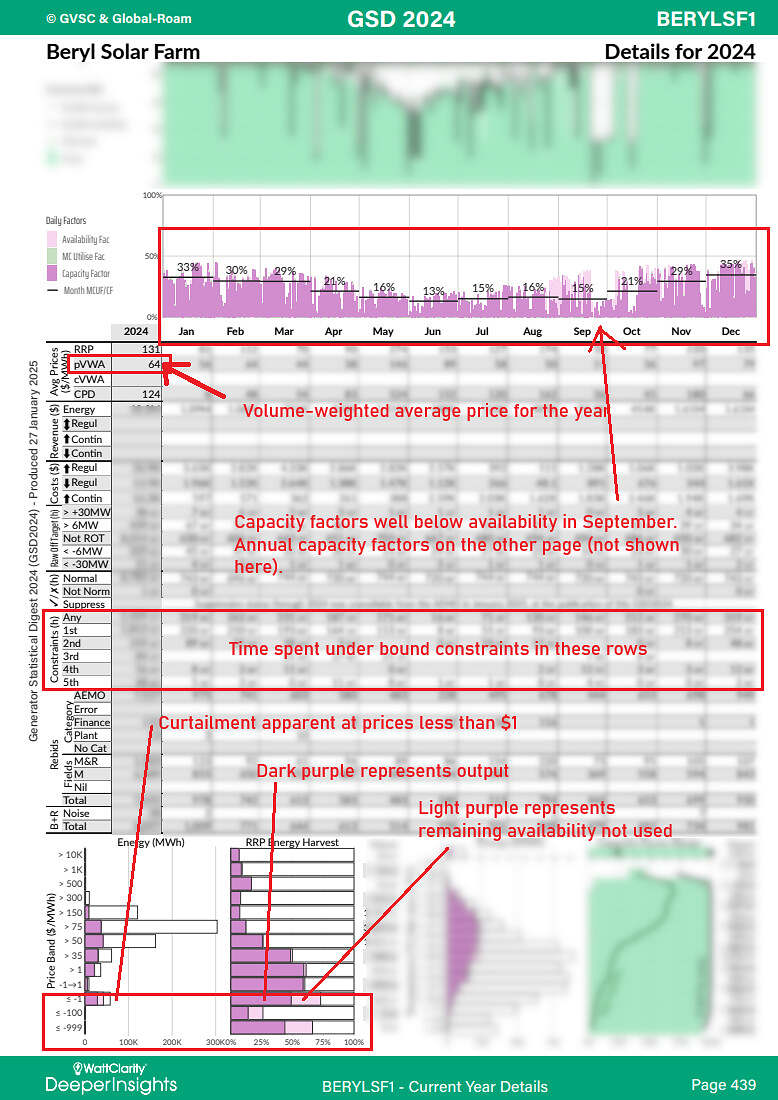
‘B page’ for Beryl Solar Farm, GSD2024. Blur used to aid focus on aspects and metrics discussed.
Annual capacity factors of 22-25% are only sometimes lower than availability factors meaning the site usually operates near its full potential. Yet there is curtailment, mostly observed August – September in recent years. The semi-scheduled unit section of GSD2024 helps us understand this is mostly economic curtailment rather than network curtailment, given the MWh values calculated in each category.
The energy harvest statistics (bottom charts on the page) indicate curtailment generally aligns with prices below $1/MWh. In contrast, when prices are above $1/MWh the harvest charts tell us there is little energy curtailed.
Mokoan Solar Farm was registered late November, 2024
The project was well advanced when the CIS results were announced. It is 46 MW max capacity generator. It was not fully operational (undergoing commissioning) in 2024 therefore not reported in GSD2024.
Mokoan solar farm is close to the two Glenrowan solar farms in Victoria which we use to contrast potential performance. Glenrowan West has been operating since 2020.
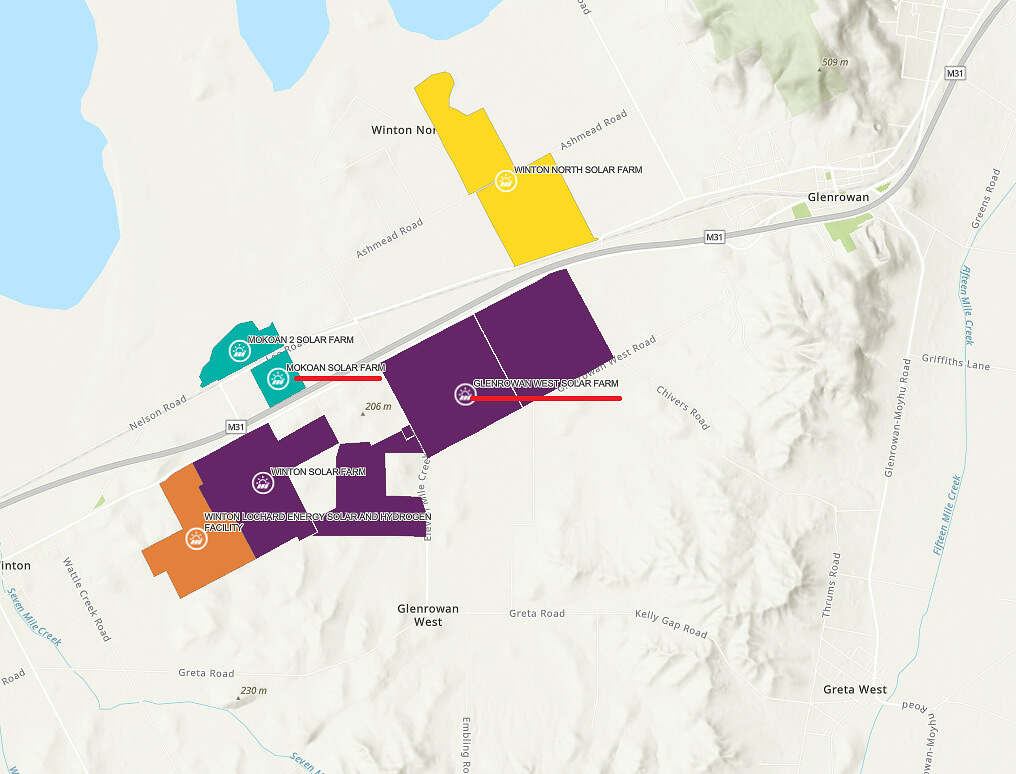
Mokoan Solar Farm is practically across the road. Map courtesy Renewable Energy Projects Victoria. Many projects are planned for this area.
In the GSD2024 ‘A’ page for Glenrowan West Solar Farm, below, we observe the site offering all its availability between $0 and -$100 in recent years. That is indicated in the Volume bid in Price Bands chart.
Output (the black line) appears lower than the offered volume in 2023 and 2024, in Spring and Summer months: black line being lower than the blue coloured bars. However annual output remains steady – stronger generation in winter.
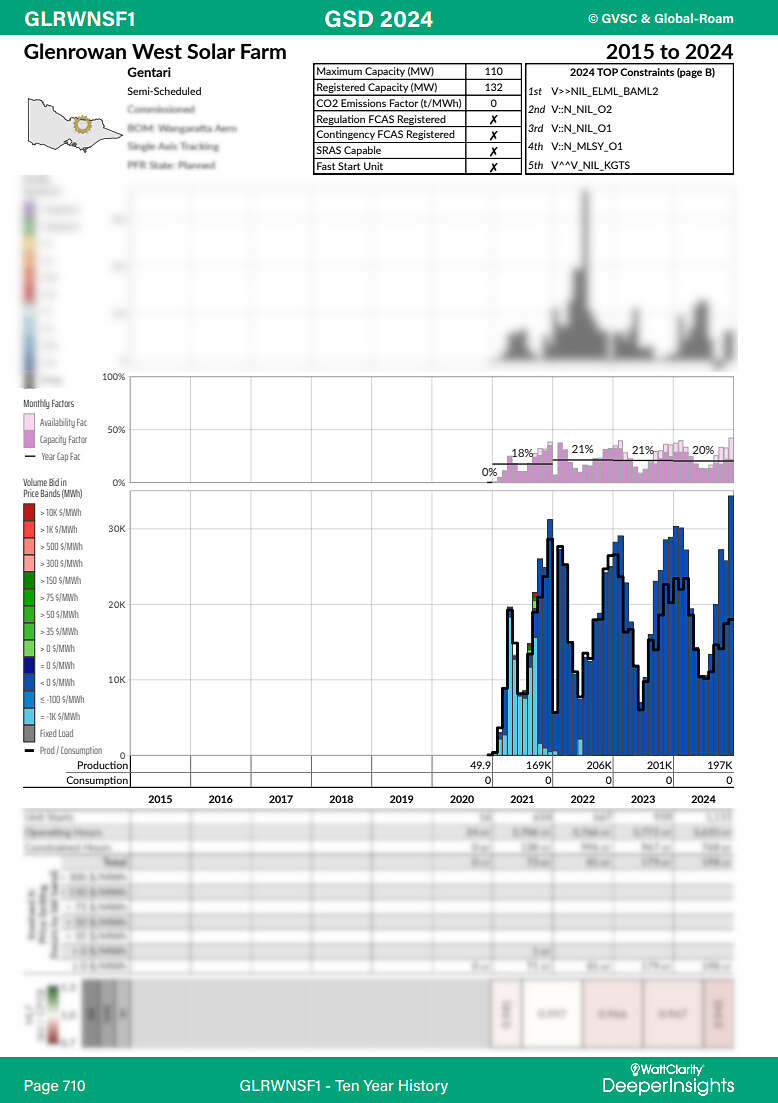
Glenrowan West Solar Farm, GSD2024 ‘A’ page.
We observe the impact of curtailment in the capacity factor bars (Monthly Factors chart) which are reduced from full availability over spring and summer months at prices somewhere between -1 and -100 $/MWh
When we inspect the semi-scheduled statistics of GSD2024 we uncover how this curtailment (output lower than availability) is generally economic. We assume in avoidance of strongly negative prices. In October 12.4K MWh was economically curtailed out of 26.9K MWh available.
Yet, even with this level of curtailment avoiding low energy prices, there were still months in 2024 when monthly energy market spot revenues was negative; October 2024 spot market revenue is estimated to be -$166K at Glenrowan West Solar Farm, associated with a negative VWAP for that month.
Now, let’s not despair. If the price of one LGC is roughly $40/MWh and production (estimated from the chart) in October was approximately 15K MWh (the GSD2024 data extract would provide a more precise number) the site may have been able to offset that spot market cost by a robust margin. Note, regulation FCAS costs not accounted-for… but they are included in GSD2024.
The B page’s energy harvest summary (below) also indicates how the site is avoiding low prices. When prices are between -1 and -100 $/MWh there is considerable curtailment relative to available power (near 50%).
Glenrowan West Solar Farm in 2024.
The volume weighted average price for Glenrowan West in 2024 was $39/MWh.
Campbells Forest Solar Farm
Situated north-west of Bendigo it is in good proximity to the 220kV transmission line from Kerang to Bendigo. Reports around the time of its planning approval indicate it would connect to a new terminal station to access the 220kV transmission line.
There aren’t many operational large-scale solar farms close by to the site, presently. For contrast we select Gannawarra Solar Farm, which is further north-west, just past Kerang.
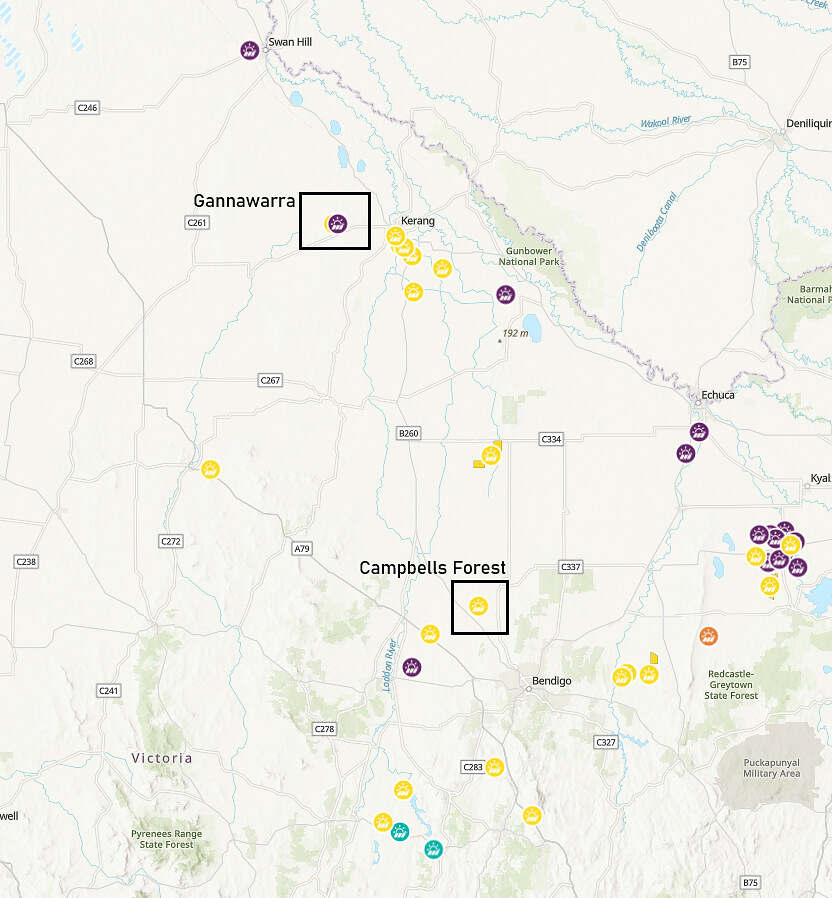
The Campbells Forest site is close to the Bendigo-Kerang transmission line. Map courtesy Renewable Energy Projects Victoria
The GSD informs us that Gannawarra Solar farm‘s connection point is at 33kV, having changed from 66kV in the early days of operation to accommodate a battery (separate dispatchable unit) late in 2018. The 50 MW solar farm’s MLF is 0.876 for the year 2024-25. This is presented at the bottom, of the ‘A’ page, below.
We also observe that constraints involving KGTS (Kerang Terminal Station) can impact generators in the area including Gannawarra. Noting, an X5 constraint makes a appearance in the top 5 constraints!
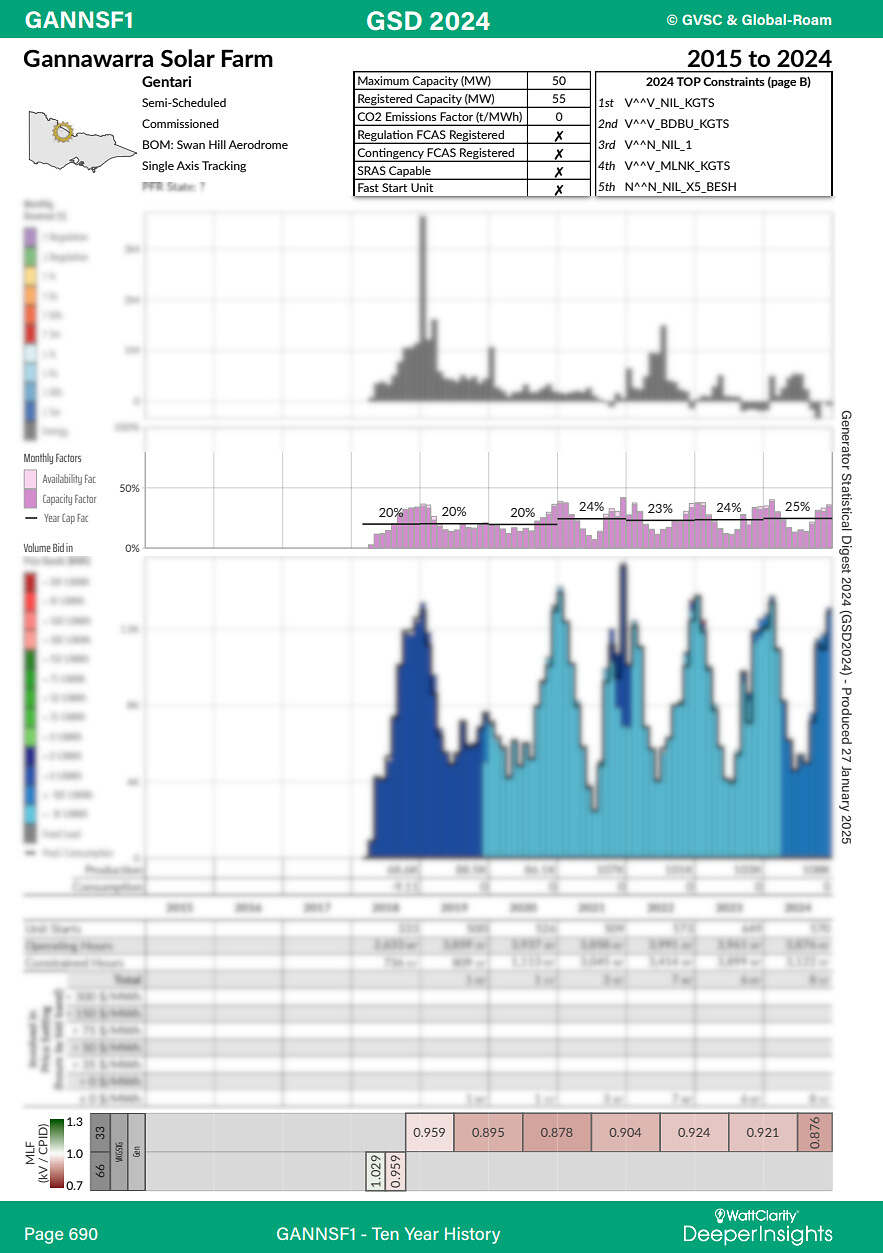
The ‘A’ page for Gannawarra Solar Farm, GSD2024.
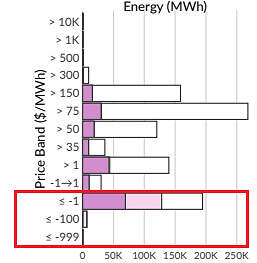
In the GSD we observe Gannawarra solar farm somewhat sparingly curtails energy for economic reasons. In contrast to Glenrowan West, discussed above, the price harvest chart for Gannawarra solar farm indicates it doesn’t economically curtail until lower prices are seen, below -$100/MWh.
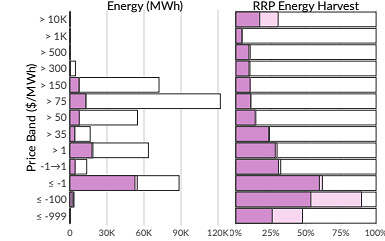
Gannawarra Solar farm in 2024.
The volume weighted average spot price (located on the ‘B’ page (not pictured) was $19 in 2024 for Gannawarra Solar Farm.
The Gannawarra battery participates in FCAS (a whole volume of GSD2024 focuses on FCAS bids and enablement) and energy, yet the Campbells Forest Solar Farm project is quiet on whether a battery will be co-located at a later date. Nonetheless it is interesting to see how revenues and costs of the Gannawarra battery compare to that of the solar farm’s even though the two assets are operated by separate companies. Reflecting on this, we can note that the two units (battery and solar) are under different operational portfolios in GSD2024. The battery is relatively small at 25 MW / 50 MWh capacity, and yet, by adding up the costs and revenues estimated in the GSD2024 the battery appears to have earned, overall, in 2024, more than 60% of what the solar farm earned in all markets combined.
Hopeland Solar Farm is a 300 MW project close to the Western Downs Green Power Hub
It is also close to the Kogan Creek Power station and Western Downs BESS. The Western Downs Green Power Hub is selected as our indicator site.
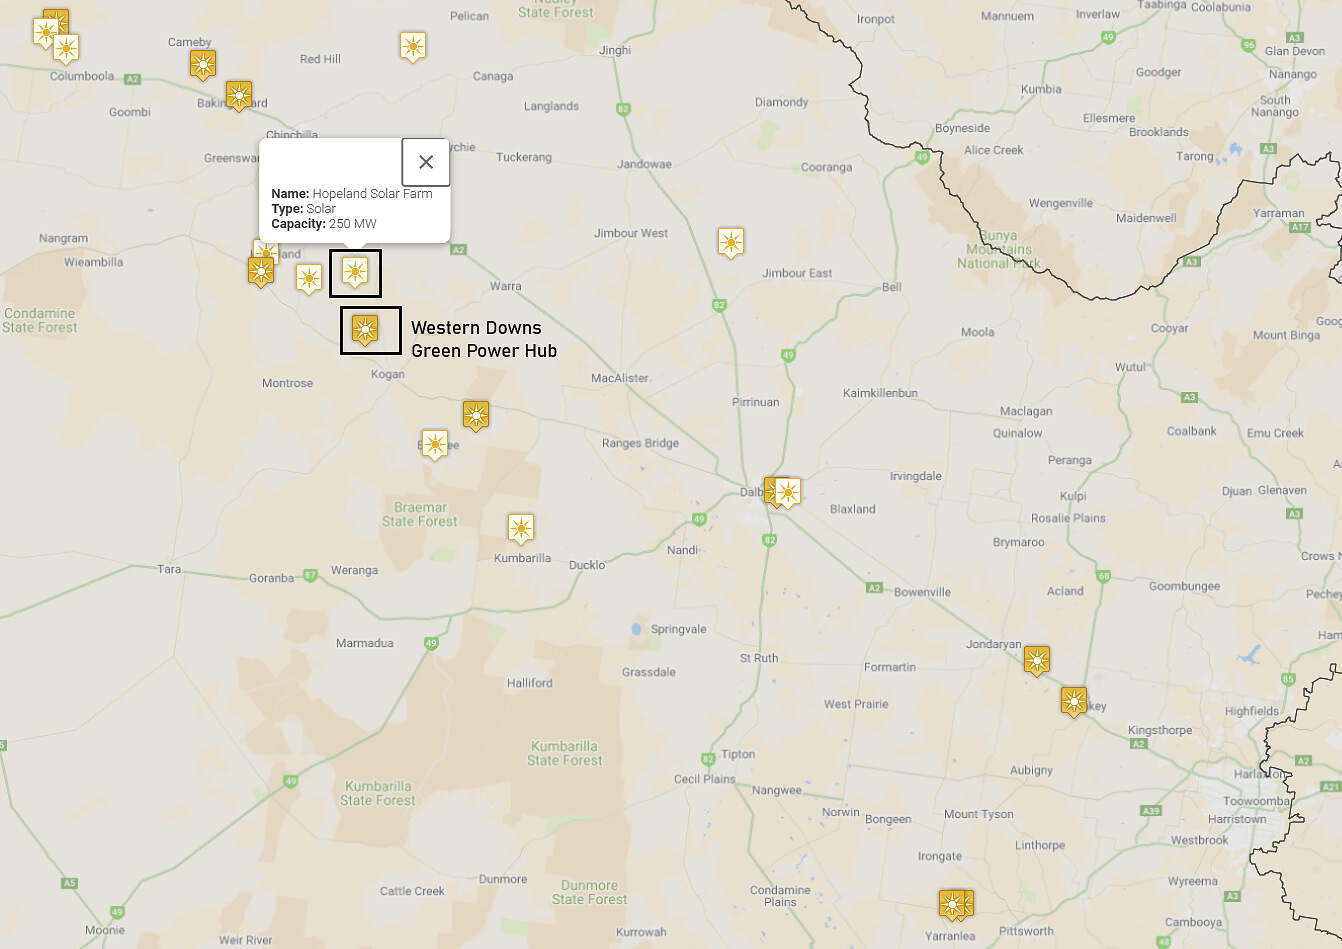
Hopeland Solar farm site. Map courtesy of the Queensland Electricity Generation Map.
Hopeland Solar Farm might currently looking at a MLF of about 0.97, connection at 275kV (based on nearby Western Downs Green Power Hub). The project website indicates it has the potential to add a battery, but detailed planning is currently underway. We will have to wait to know more about that aspect.
When we delve into the performance of the Western Downs Green Power Hub (400 MW max capacity) we can immediately note that it is registered for FCAS (lower and regulation), yet in 2024 the FCAS revenues were only about 2% of energy market revenues.
Western Downs green power hub appears to conscientiously avoids low price periods.
In September 2024, when the average RRP was $50/MWh, the generator curtailed more energy than it produced. And, using the semi-scheduled volume statistics, 96% of the curtailment was economic in that month, leading to a 12% capacity factor for the month.
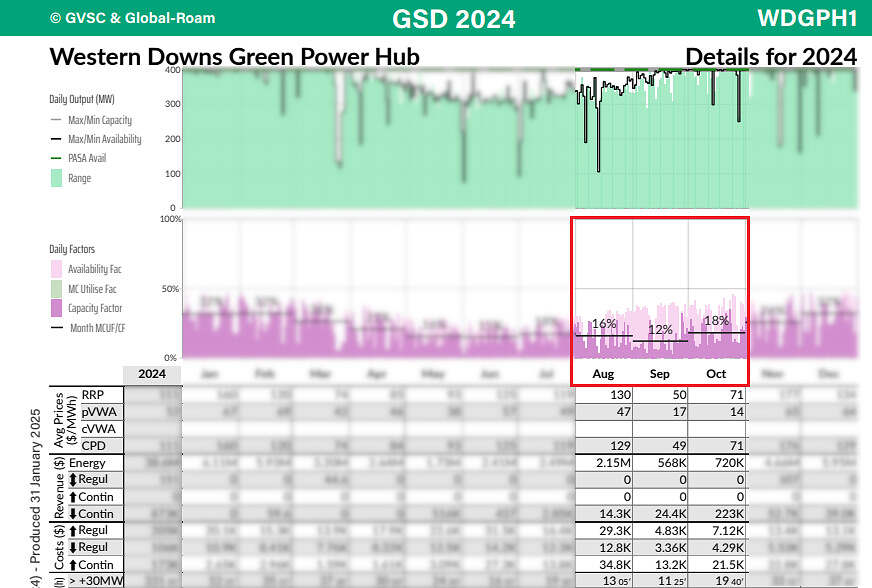
Western Downs Green Power Hub curtailment in August – October was considerable as indicated by difference between capacity factor and availability factor.
We can see this overall curtailment at low prices once again in the energy harvest charts:
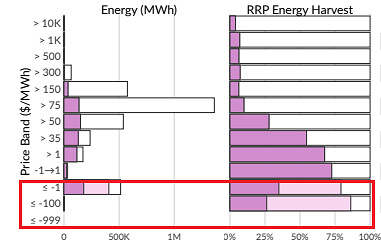
Western Downs Green Power Hub energy harvest in 2024.
The unit’s energy harvest appears to support a higher volume weighted average price which, for Western Downs Green Power Hub, was a handsome $52 for the year.
Further information on GSD2024 is at the WattClarity Deeper Insights pages.
Leave a comment