Back on 2nd September 2024 we wrote how ‘Curtailment of Solar Resource from (Semi-Scheduled) Large Solar across the NEM reaches 79.2% on Sunday 1st September 2024’.
We’ve already noted that yesterday (Sunday 16th February 2025) featured:
1) Lower ‘Underlying Demand’ given the far-from-summer temperatures across the southern part of the NEM; and also
2) Clear skies across much of the NEM, giving solar (both small and large).
This combination led to very low level of demand in NSW, for instance.
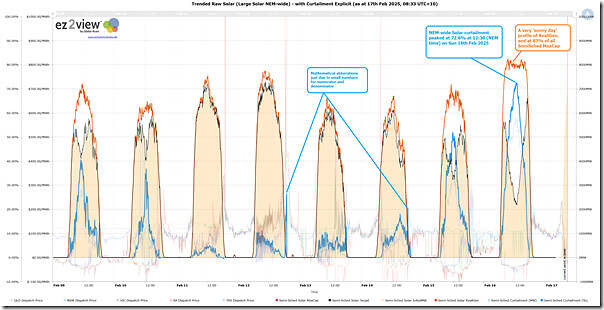
So I wondered what the situation was in terms of curtailment of Large Solar across the NEM. Quickly opening up the same ‘Trends Engine’ query in ez2view and configuring to look at the most recent week, we see the following:
Briefly:
1) On Sunday we see curtailment (for whatever reason) peaked just over 72% of solar availability in the middle of the day
2) We also see a very ‘sunny day’ profile for Available Generation at about ~8,000MW which, when combined with the installed capacity* of Large Solar of 9,599MW (i.e. Semi-Scheduled units), reveals an availability of ~83% over many solar hours in the day.
* using MaxCap and noting these considerations.


Be the first to comment on "Curtailment of Large Solar reaches ~72% (NEM-wide) on Sunday 16th February 2025"