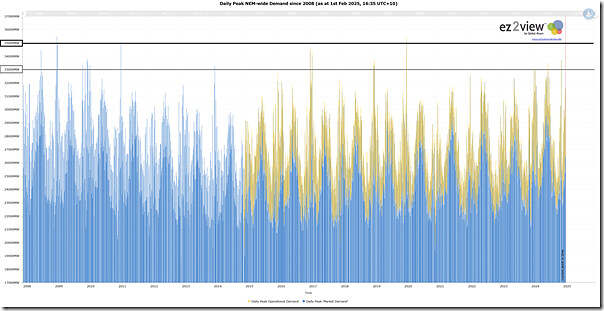
A trend of daily peak NEM-wide ‘Market Demand’– from 1st January 2028 to 31st January 2025

With respect to forecasts for peak NEM-wide ‘Market Demand’ in summer 2024-25 (and particularly following Friday’s article noting ‘Forecasts ‘hotting up’, for NEMwide demand on Monday 3rd February 2025’) we fielded a few questions about how extreme that might be.

So we thought we’d provide this article as some context.

Should NEM-wide ‘Market Demand’ surpass 33,000MW the headline could be:

  • Certainly not highest ever, in a historical sense
  • But well worth noting, given how rare an occasion it is.


(A)  A brief reminder about the complexity of measuring ‘Demand’ … because

…. it’s not as simple as some might initially think

Those readers who want for the gory details can read them here, but the short story is that there’s essentially three measures of demand that are commonly talked about, and they are not really interchangeable.  Starting from the top and working down…


# Measure of demand Brief Explanation

#0

‘Absolutely Everything Consumed’

This is something we don’t hear much spoken about because it would include other things, on the top of ‘Underlying demand’ in that we’d also add in energy consumed via Scheduled Loads (i.e. in charging batteries from the grid and the few pumped hydro as well).

#1

‘Underlying Demand’

This measure is increasingly used, to represent ‘real’ consumption for purposes other than just time-shifting energy:

  • i.e. not batteries charging from the grid, or pumped hydro.
  • though it’s important to note that, by virtue of how it’s approximated, it does consider what would be a growing volume of energy flowing into residential batteries ‘behind the meter’ from rooftop PV systems!

Given the invisibility of some aspects of this ‘behind the meter’ consumption, and also  the ongoing opacity of rooftop PV (which is growing in volume) it seems most people estimate this by adding onto ‘Operational Demand’ the estimate of production from <100kW rooftop PV.

#3

‘Operational Demand’

As we can see from the chart above, this measure the AEMO has only been publishing since late 2014 (and then only on a half-hourly basis).  So only ~11 years of history in a market that’s >26 years old.

Some might think about this as ‘Grid Demand’.

AEMO increasingly refers to this because it most closely relates to the consumption that they can ‘see’ in real time, and hence relates to their ‘keeping the lights on’ functions.

#3

‘Market Demand’

This measure the AEMO has been publishing on a 5-minute cadence (i.e. for every dispatch interval) since the start of the NEM.

It’s a number that is fed into NEMDE and hence which plays a key role (along with bidding behaviour) in determining price outcomes.

The MMS field name is ‘TOTALDEMAND’, but ironically it’s not ‘total’ in the layperson sense!

Whilst AEMO increasingly looks at ‘Operational Demand’ many in the wholesale market still look closely at ‘Market Demand’ because that most closely relates to:

  • Which Scheduled and Semi-Scheduled units will be dispatched; and
  • What the prices will be, so what they will be paid.


With this in mind, let’s look on….


(B)  A long-range trend of daily peak

So utilising the ‘Trends Engine’ within ez2view we’ve put the following trend together, showing both ‘Market Demand’ and ‘Operational Demand’ (noting that reconstructing an estimate of ‘Underlying Demand’ over such a long time range is more complex and we don’t have time to do this today for this brief article.

2025-02-01-at-16-35-ez2view-Trend-DailyPeak-NEMwide-Demand

Remember to click on the image for a larger-resolution view.

For ease of reference, I’ve added a horizontal line:

  • at 35,000MW (only 4 days have ever seen higher) and
  • at 33,000MW (only 32 days have ever seen higher … in 6,241 days (so 0.5% incidence))


(C)  A tabular listing of some of those high demand days

With the above chart as a reference, here’s some of the high points in each year noted (with some linked to articles written at the time).


Year Brief Explanation of the peak for the year,

in terms of ‘Market Demand’

2008

1 day over 33,000MW … this

  • was 28th July 2008 (peak 34,394MW) … which I think is the only winter day in the list.

2009

2 day over 35,000MW … which were:

  • Thu 29th Jan 2009 (35,478MW … still highest day ever) and
  • Fri 30th Jan 2009 (35,099MW).

Another 8 days (10 in total) over 33,000MW.

2010

5 days over 33,000MW

2011

5 days in a row over 33,000MW – including in the middle one day over 35,000MW:

  • Wed 2nd Feb 2011 at 35,005MW

2012

0 days over 33,000MW

2013

0 days over 33,000MW

2014

1 days over 33,000MW …

  • Thursday 16th January 2014 (33,223MW).

2015

0 days over 33,000MW

2016

0 days over 33,000MW

2017

2 days over 33,000MW … which were:

  • Tuesday 17th January 2017 (34,396MW)
  • Friday 10th February 2017 (34,042MW)

2018

0 days over 33,000MW

2019

5 days over 33,000MW in January 2019:

  • Tuesday 15th January 2019 (33,208MW)
  • Thursday 17th January 2019 (33,074MW)
  • Tuesday 22nd January 2019 (33,077MW)
  • Thursday 24th January 2019 (33,150MW)
  • Friday 25th January 2019 (33,329MW)

… and nothing for the rest of the year

2020

January 2020 saw both:

  • Thursday 30th January 2020 saw 34,257MW … a day with some articles written
  • Friday 31st January 2020 saw 35,169MW … a day we wrote many articles about

2021

0 days over 33,000MW

2022

0 days over 33,000MW

2023

0 days over 33,000MW

2024

Monday 16th December 2024 reached 33,674MW.

2025 ytd

This year is only very young … only 1 month old.

The highest daily peak so far this year has been 31,528MW on Monday 27th January 2025.

If Monday 3rd February 2025 exceeds 33,000MW it would be the first day in the year


So let’s wait to see what unfolds…


About the Author

Paul McArdle
Paul was one of the founders of Global-Roam in February 2000. He is currently the CEO of the company and the principal author of WattClarity. Writing for WattClarity has become a natural extension of his work in understanding the electricity market, enabling him to lead the team in developing better software for clients. Before co-founding the company, Paul worked as a Mechanical Engineer for the Queensland Electricity Commission in the early 1990s. He also gained international experience in Japan, the United States, Canada, the UK, and Argentina as part of his ES Cornwall Memorial Scholarship.

Be the first to comment on "A trend of daily peak NEM-wide ‘Market Demand’– from 1st January 2028 to 31st January 2025"

Leave a comment

Your email address will not be published.


*