It didn’t take long into the new year for the AEMO to publish its first ‘forecast LOR2’ notice … this one pertaining to the NSW region and looking forward to Monday 6th January 2025 in MN122695 at 04:28 (NEM time), with the key point from that note being the following line:
‘The minimum capacity reserve available is 509 MW.’
The following (MN122697) followed shortly afterwards, published at 06:51 (NEM time):
‘——————————————————————-
MARKET NOTICE
——————————————————————-
From : AEMO
To : NEMITWEB1
Creation Date : 02/01/2025 06:51:33
——————————————————————-
Notice ID : 122697
Notice Type ID : RESERVE NOTICE
Notice Type Description : LRC/LOR1/LOR2/LOR3
Issue Date : 02/01/2025
External Reference : STPASA – Update of the Forecast Lack Of Reserve Level 2 (LOR2) in the NSW Region on 06/01/2025
——————————————————————-
Reason :
AEMO ELECTRICITY MARKET NOTICE
The Forecast LOR2 condition in the NSW region advised in AEMO Electricity Market Notice No. 122695 has been updated at 0645 hrs 02/01/2025 to the following:
From 1500 hrs 06/01/2025 to 1830 hrs 06/01/2025.
The forecast capacity reserve requirement is 700 MW.
The minimum capacity reserve available is 103 MW.
AEMO is seeking a market response.
AEMO has not yet estimated the latest time it would need to intervene through an AEMO intervention event.
Manager NEM Real Time Operations
——————————————————————-
END OF REPORT
——————————————————————-’
So in the ~140 minutes in between 04:28 and 06:51 this morning, the forecast supply-demand balance grew tighter by ~400MW.
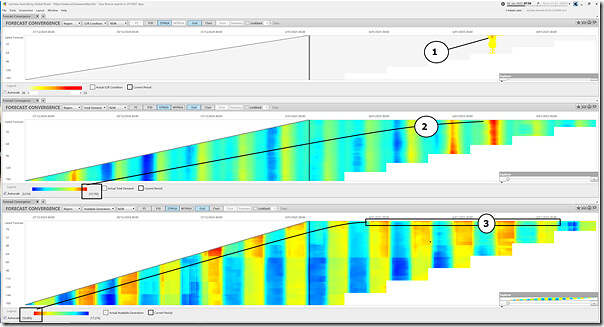
Toggling to the ‘Forecast Convergence’ widget in ez2view at the 07:50 dispatch interval and looking forward into the ST PASA forecast data sets, the following two images capture some contributing factors:
Frequent readers (and licensed users of ez2view) will remember that this widget allows one to ‘look up a vertical’ in order to ‘see that other dimension of time’.
We can see:
1) In the top chart, the ‘forecast LOR2’ period (in orange) grow broader in the most recent run (at the top of the Grid)
2) We can see the forecast ‘Market Demand’ (above 12,000MW on Monday 6th January 2025) is higher than in the surrounding days, and is getting hotter in more recent forecasts
3) We can see that the more recent forecasts for ‘Available Generation’ see a drop (of ~400MW) compared to earlier forecasts.
(a) So presumably some outage has been extended, or a new one slated?
(b) I’ve not looked further, at this point.
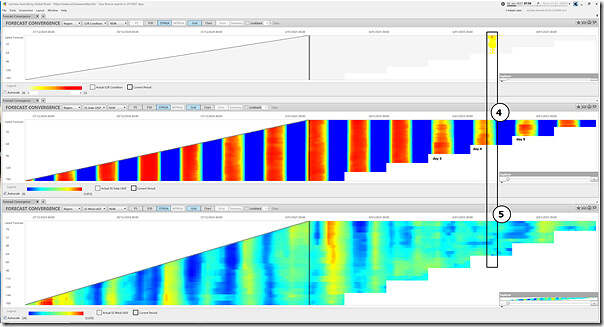
For more context we flip the two windows at the bottom to show UIGF for Solar and for Wind in NSW, and see more of the picture:
Coupled with the above factors, we also see:
1) Whilst the next three days (Thu 2nd, Fri 3rd and Sat 4th January) are forecast to see strong yield potential* from Large Solar Farms across NSW, the following 3 days (matching day 3, day 4 and day 5 of the India vs Australia Test Match in Sydney) are showing decidedly more modest Solar Yield Potential.
* barring network curtailment or economic curtailment, which might reduce the actual output.
2) We also see forecast modest yield potential* from Wind Farms across NSW for Monday 6th January 2025 (i.e. current forecasts approximately ~700MW only).
* barring network curtailment or economic curtailment, which might reduce the actual output.


The links in “network curtailment or economic curtailment” go to 404.. 🙂