
The drop in system frequency on Saturday 5th October 2024 was initially reviewed in Drop in System Frequency (approx 15:45 NEM time) on Saturday 5th October 2024.
A sudden frequency drop is typically caused by a loss of generation, relative to what is expected or dispatched to meet demand.
At the time, the review didn’t find a single ‘smoking gun’ however it did observe some large deviations below dispatch level:
- 177 MW at QLD solar unit Western Downs Green Power Hub at the end of the 15:40 interval, and
- Two solar units in QLD (181 MW) and considered another in NSW (NEWENSF1, 38MW) at the end of the 15:45 interval, and
- Overall, a NEM-aggregate 606 MW deviation (of underperformance) was calculated at the end of the 15:45 interval.
But questions remain: Were there other units contributing a shortfall of generation, and were other units resisting by overperformance (in addition to VBB1 as noted in the initial review)?
To further understand the frequency drop we delve into the 4-second data (used for regulation FCAS contribution calculations) in this Part 2, looking at generating units (including BDUs).
The sudden frequency drop
The frequency drop happened in the 15:40 and 15:45 dispatch intervals, and by the start of the 15:50 interval it was on it’s way back towards 50 Hz.
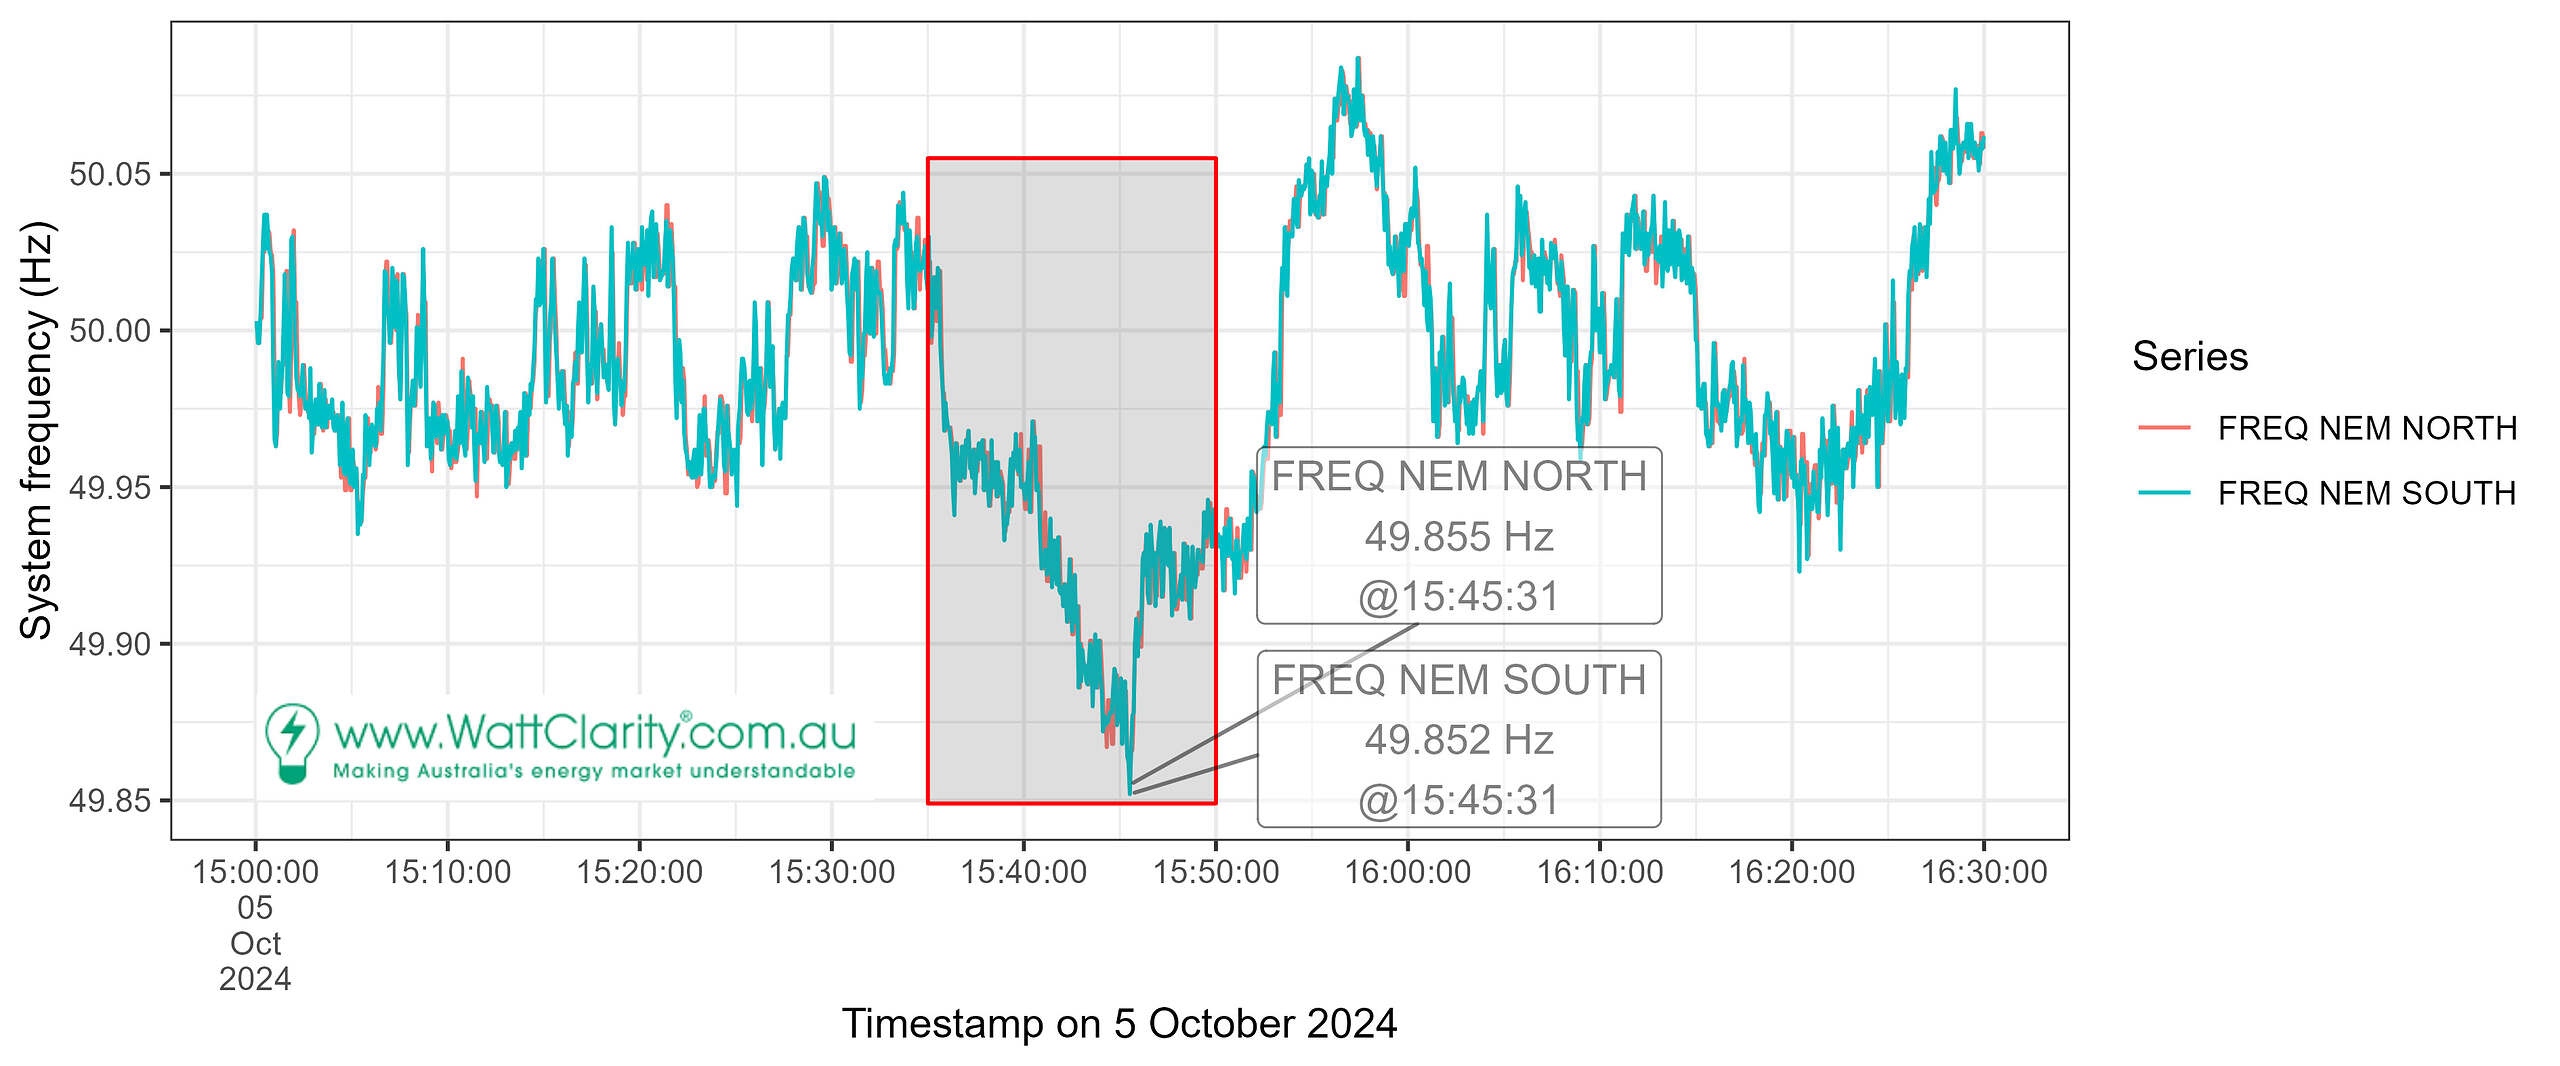
5th October 2024 mainland frequency drop
We’ve inspected the 4-second data unpack which units contributed, both positively and negatively.
We’ve analysed the time period highlighted in the box, charted above. That is, from 15:35 to 15:50, meaning the three dispatch intervals discussed in the initial review. This analysis period aims to capture the beginning of the decline and the first interval after the nadir.
Contributors to frequency decline
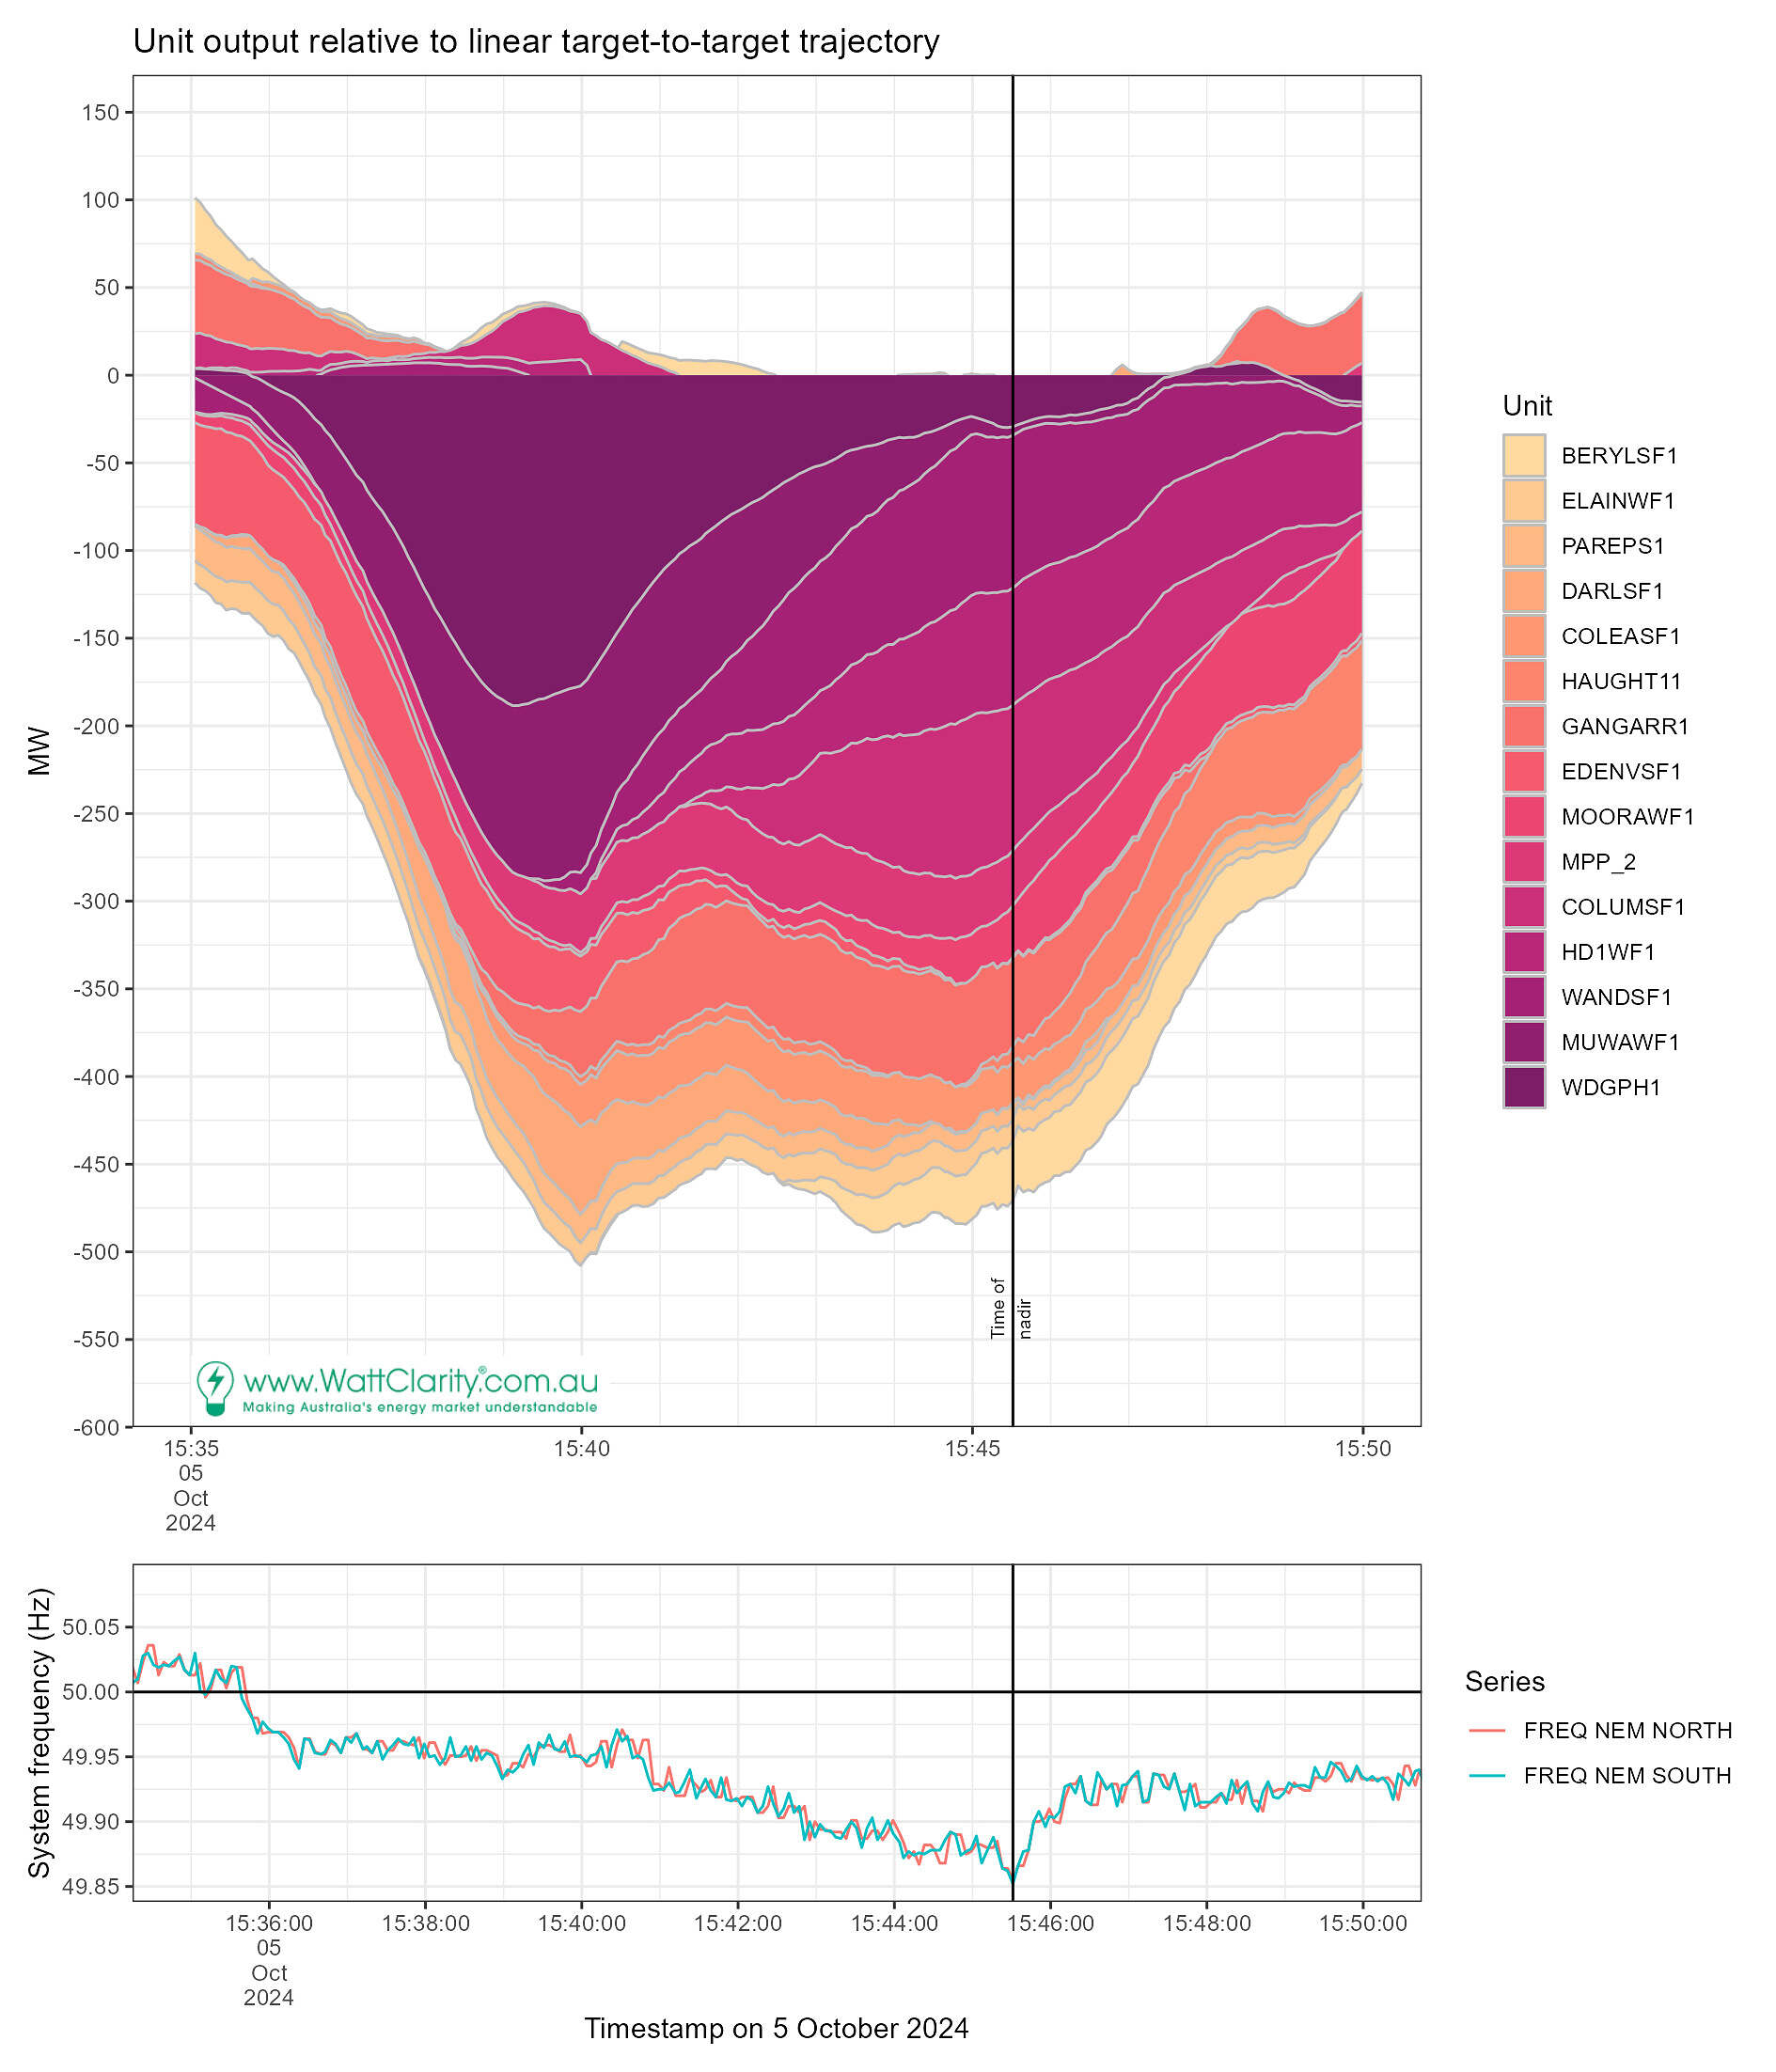
The following chart summarised the 15 units that contributed the most towards frequency decline.
We’ve derived the list by calculating the average deviation over the analysis period (the three dispatch intervals).
At each timestamp a deviation was calculated as the difference between the unit’s MW reading and the reference trajectory. The reference trajectory is the straight-line interpolation between the dispatch targets of successive dispatch intervals.
Time period 15:35 – 15:40
The largest contributor to the decline in frequency was Western Downs Green Power Hub (WDGPH1), QLD. Second was Murra Warra 1 Wind Farm (MUWAWF1), VIC.
We can see how the deviations from this top 15 list expanded from -125MW to -500 MW by interval-end.
Yet we also see a resistance in the frequency, sticking to 49.95.
Time period 15:40 – 15:45
The deviations of WDGPH1 and MUWAWF1 are observed to be gradually shrinking.
Yet, we know the frequency dropped further to its low-point in this interval.
Expanding negative deviations are observed at WANDSF1 (solar, QLD), HD1WF1 (wind, VIC), COLUMSF1 (solar, QLD), GANGARR1 (solar, QLD).
Our list totals a deviation of -475 MW at the end of the 15:45 interval. This represents 78% of the aggregate 606 MW underperformance highlighted in the initial review.
In this interval MPP_2 (Millmerran) is also represented in a slice. The rebid reason soon after this interval suggests mill/feeder limitations were impacting the unit.
Time period 15:44 – 15:50
This interval saw the beginning of the frequency returning towards the 50 Hz target. Aside from HAUGHT11 (solar, QLD) and MOORAWF1 (wind, VIC) most units in this list saw reducing deviations by interval-end.
While the frequency was sub-optimal at 15:50 (just below 49.95) the first chart in the article shows it climbed steadily after that time, reaching 50Hz roughly 2.5 minutes later.
Contributors to frequency rise (resistance to decline)
It’s clear from this analysis that the Victorian Big Battery (VBB1) made the greatest positive contribution. Exporting roughly 130 MW over its energy target (of 0 MW) at 14:45.
TUNGATIN (Tungatinah) is a hydro unit in Tasmania. Its impact on mainland frequency may have been indirect, being in Tasmania and separated by the DC Basslink, though I’ve not delved further.
Torrens Island Battery (TIB1) appears to have positively contributed (around 50MW) in the 15:45 to 15:50 period.
Collectively, also, LYA and LOYYB played a strong role with units exporting approximately 90 MW above energy targets in the 15:40 to 15:45 period.
Our list here captures an aggregate of almost 450 MW of over performance, slightly more than the underperformance of the units above (15:45 interval-end).
Note we haven’t differentiated units enabled for provision of FCAS from units dispatched for energy-alone.
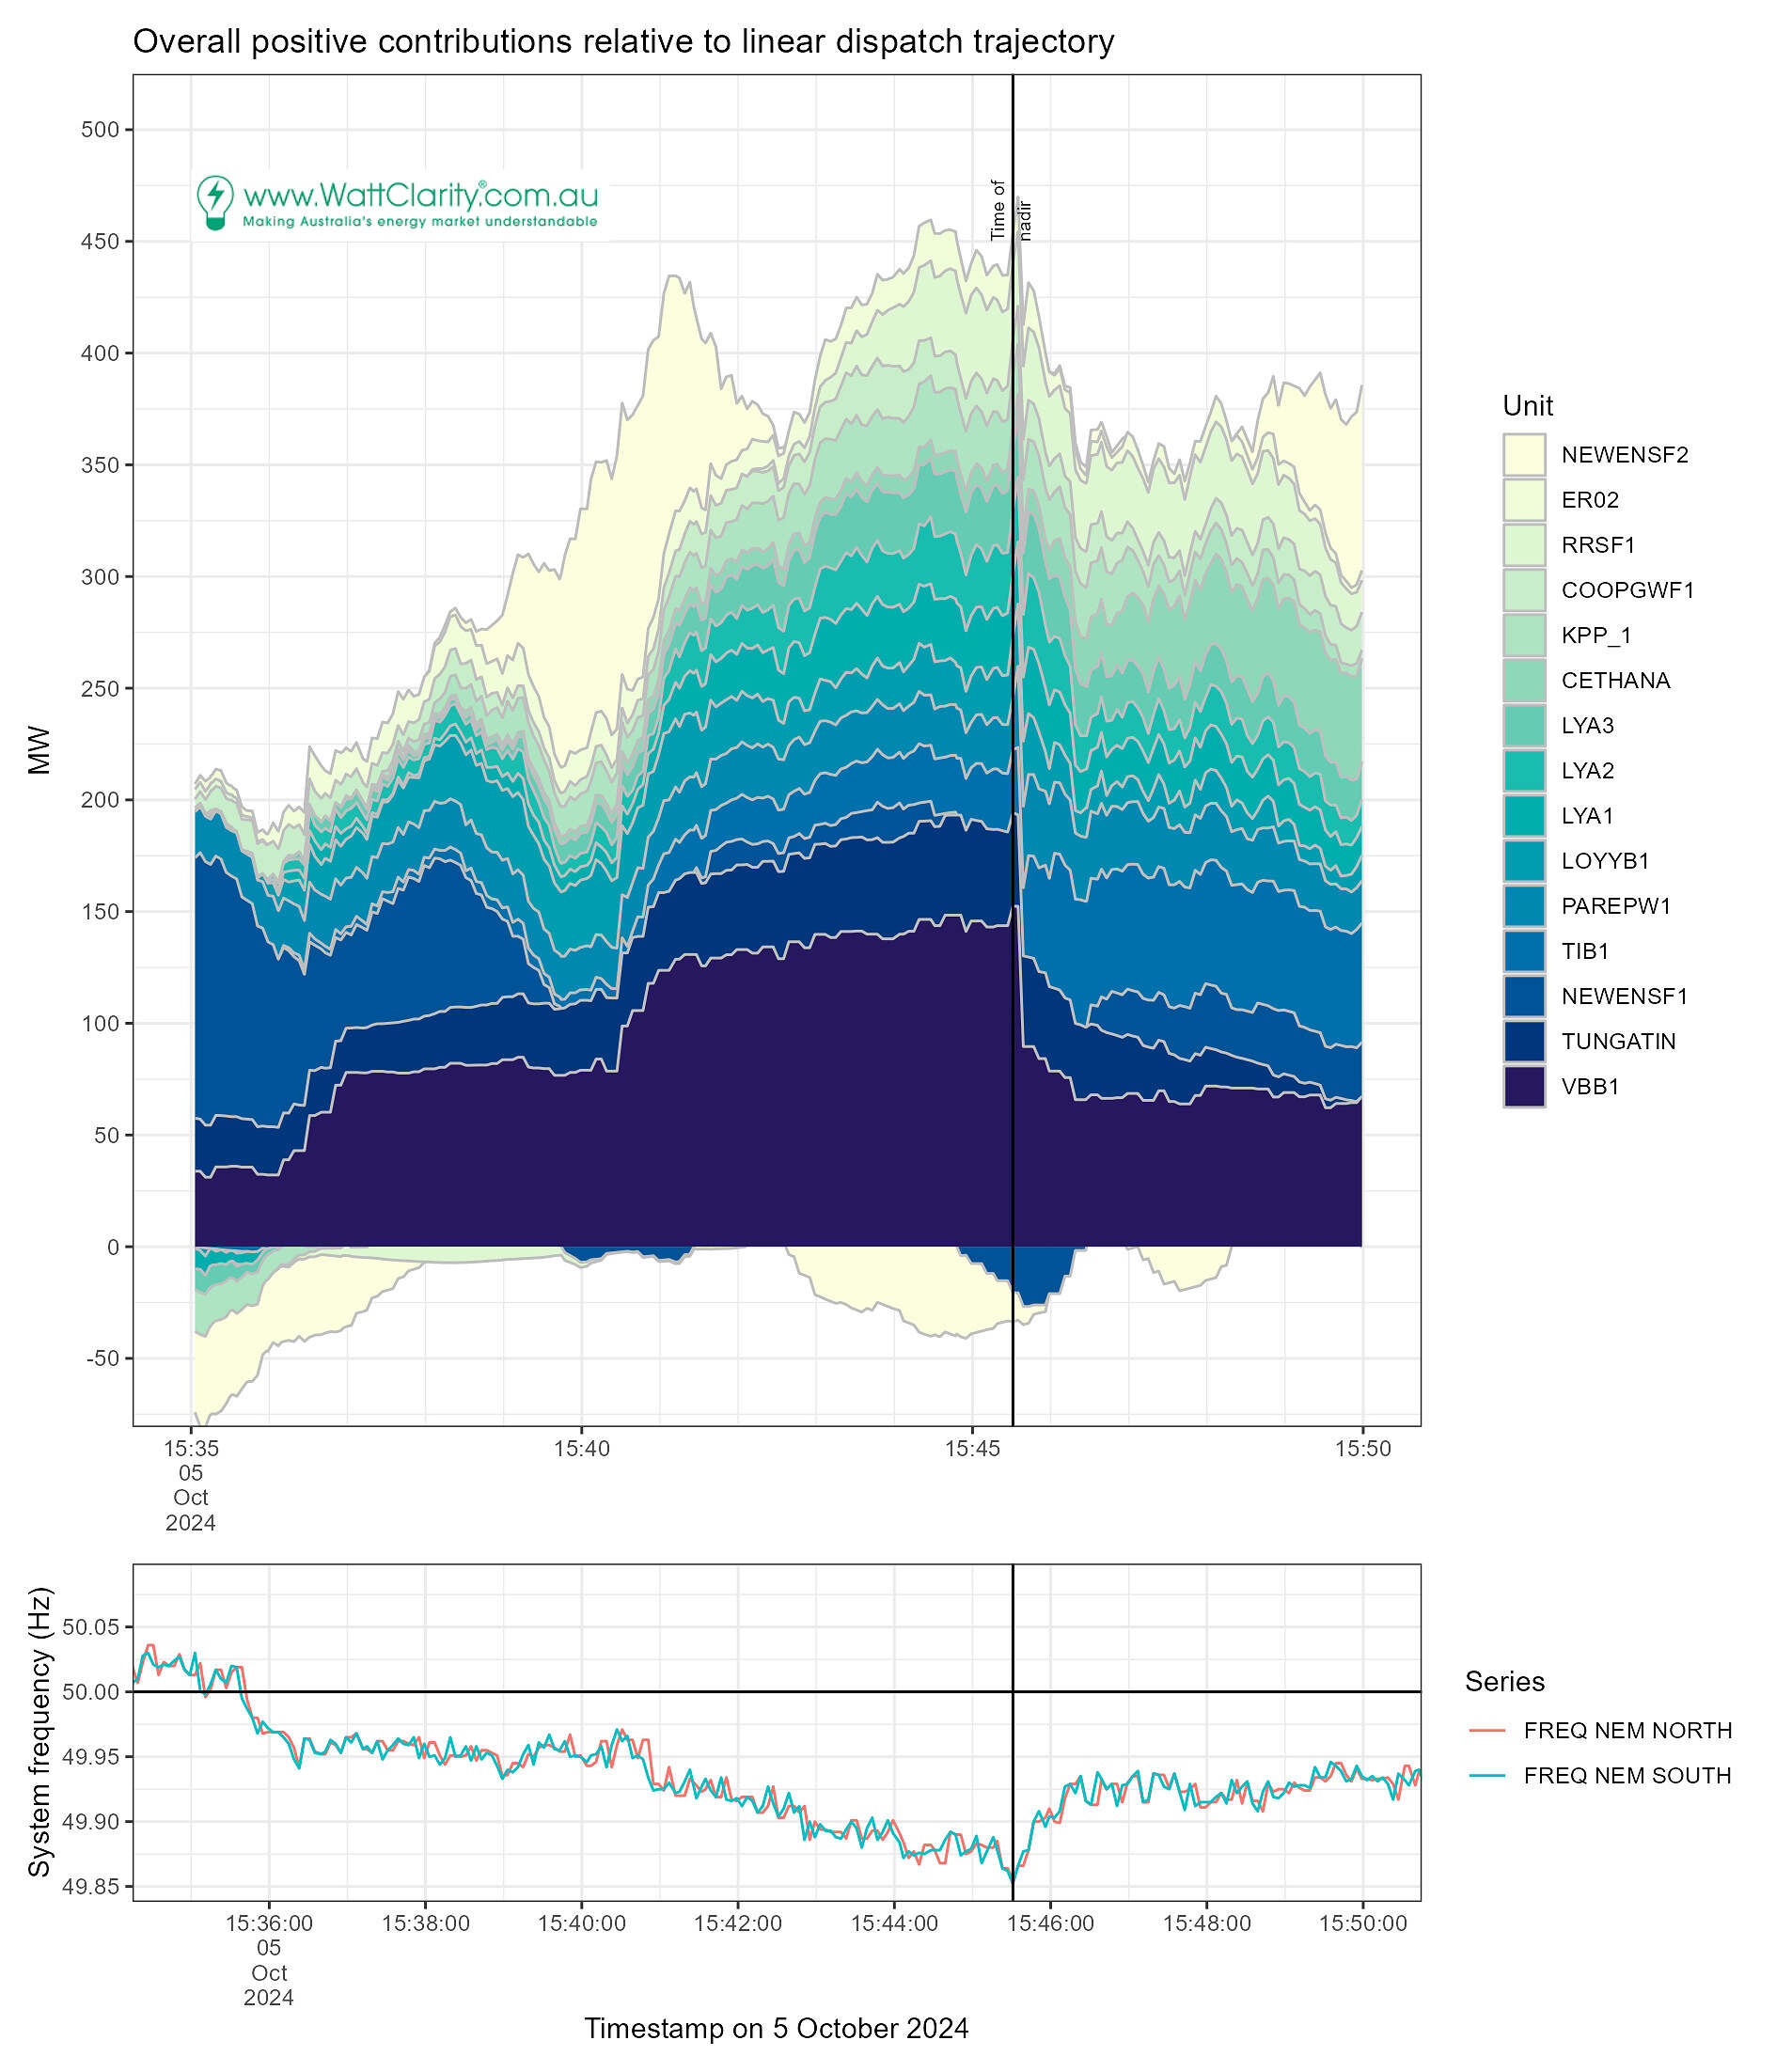
In the above chart NEWENSF2 also makes an appearance. This is predominantly because of its large deviation around 15:39 to 15:42.
It did also make a mention, for opposite reasons, in the initial review. Its final MW was about 38 MW lower than target at the end of the 15:45 interval suggesting it also contributed to the frequency decline.
We can see NEWENSF2’s contribution to decline as negative MW differences in the above chart around 15:43 to 15:46.
Provision of RAISEREG?
Positive contributions to oppose the decline are expected through provision of the regulation raise service.
The following chart presents the raw amount of Regulation FCAS allocated to a generating unit by the AGC.
We’ve listed all units with a non-zero value for this measure over our analysis period.
As there are so many units text labels are added, at 15:50 for the cumulative MW level, to aid in distinguishing units.
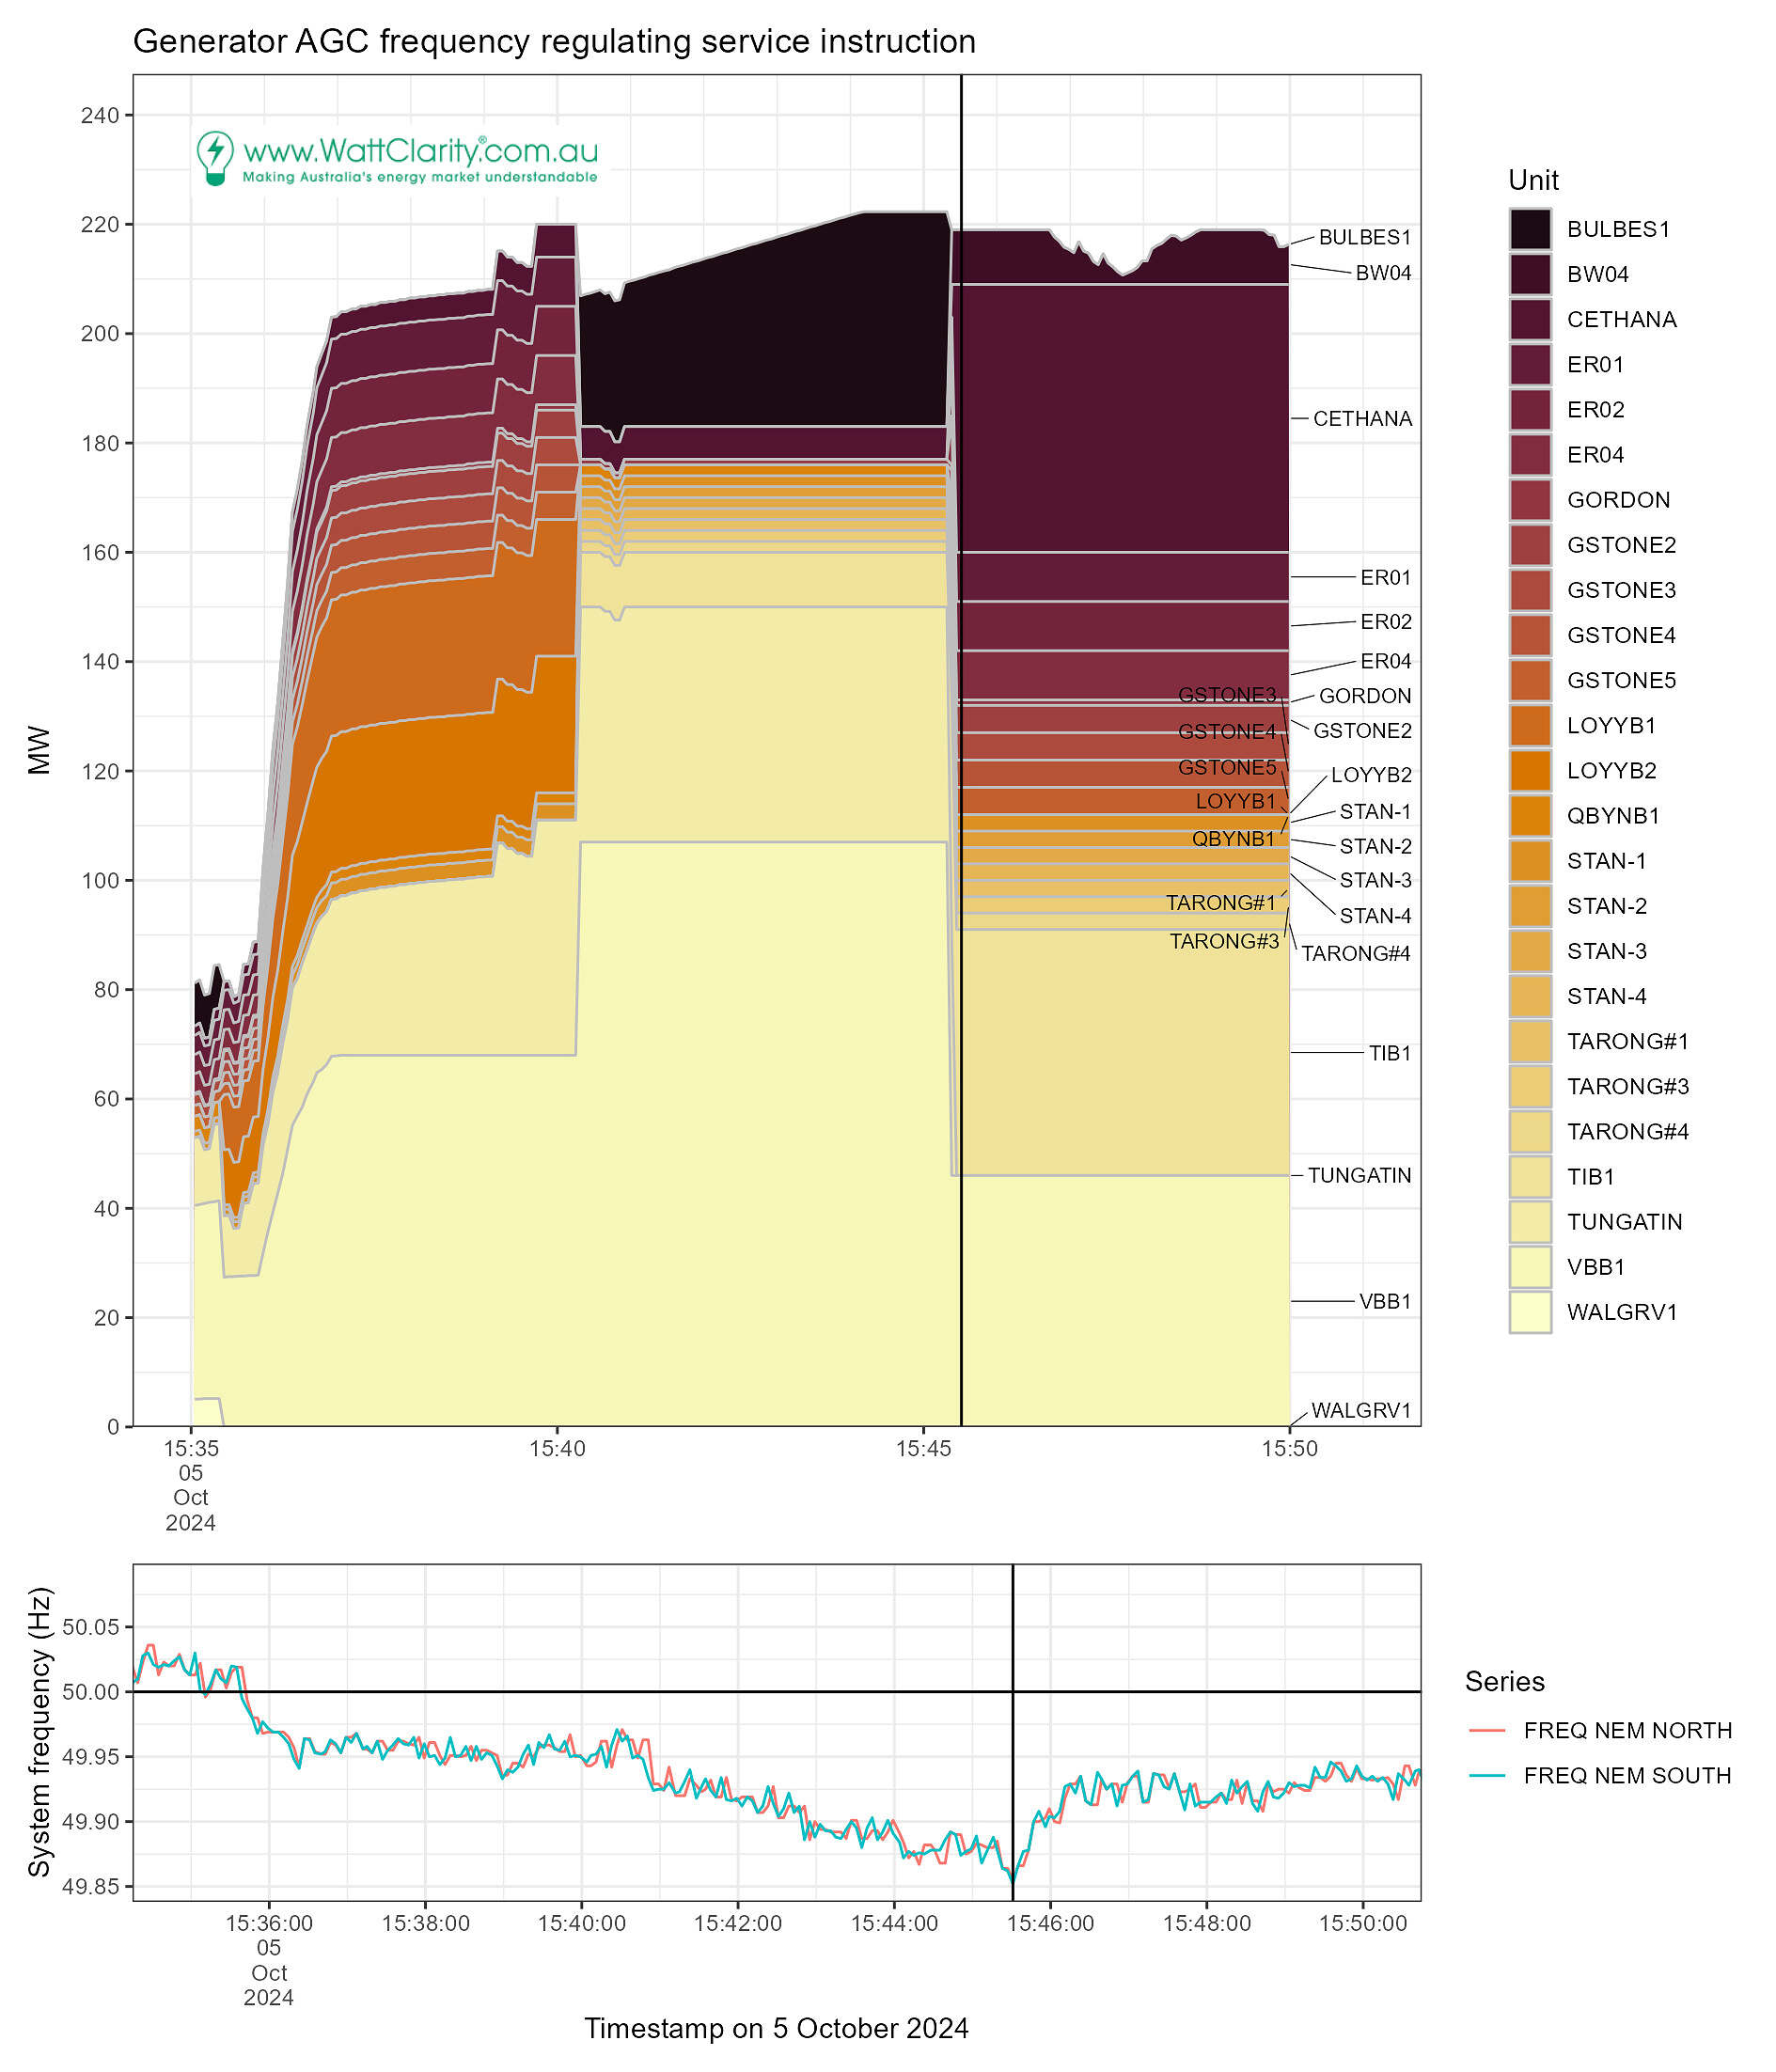
We can see that VBB1 and TIB1, and TUNGATIN all received instructions to raise the frequency through the regulation FCAS service. Absent are NEWENSF1&2 which were not participating in Reg FCAS, supporting that their presence as contributors to frequency raise was not because of central dispatch.
Loy Yang A units were not instructed to overproduce for Reg FCAS reasons. We do observe that LOYYB1 was instructed (in the 15:40 dispatch interval only).
Notably, BULBES1 received raise instructions in excess of 40 MW in the 15:45 interval (it’s energy target was to consume!) but did not appear as a major contributor in our above assessment (output relative to linear energy target trajectory). This is because, in our ranking, it was ranked 16th. Although it delivered as instructed it missed out list which was restricted to the top 15.
What to make of all this?
We’ve analysed a drop in mainland frequency. The drop did remain within the NOFB, narrowly. So, normal operation, shall we say.
Yet it is of interest to uncover how this came about. The energy transformation is charging ahead as we introduce more renewables and storage into the grid. At the same time we are anticipating the retirements of thermal plant also happen as announced.
Inspecting generator and bidirectional unit behaviour, the main contributors to the decline were found to be a mixture of VRE resources (wind and solar), in a mixture of locations (VIC and QLD predominantly). Yet, the solar units were in QLD generally and the wind units were in VIC.
The main contributors to resisting and restoring the frequency were batteries, with coal units also contributing, among some hydro in Tasmania and some (apparent) coincidental positive deviations from VRE resources.
So, in wondering if the Semi-Scheduled category, as it currently works, is scalable and sustainable, might we also consider keeping a closer future eye on whether adding wind and solar has upped the need for FCAS in the NEM.
Leave a comment