We earlier wrote about ‘Spot price volatility in South Australia on Thursday (morning) 17th October 2024’.
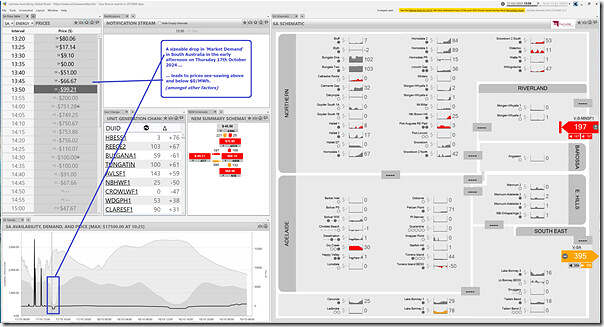
As another brief (and also somewhat cryptic) background, get a load of this drop in ‘Market Demand’ in South Australia just prior to the 13:50 dispatch interval (NEM time) this afternoon – captured in this collage of widgets from our ez2view software:
Let’s briefly stop and check …
A very large drop in ‘Market Demand’
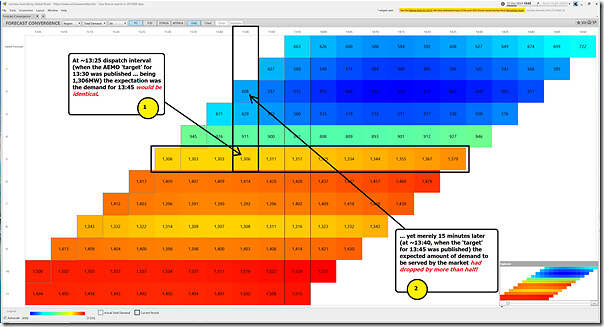
Specifically the change in ‘Market Demand’ was:
1) In sequence:
(a) At 13:30 the ‘target’ was 1,306MW
(b) At 13:35, the ‘target’ was 945MW
(c) At 13:40, the ‘target’ was 671MW
(d) At 13:45, the ‘target’ was 608MW
2) So in terms of size of drop:
(a) 361MW drop in 5 minutes (down 28%)
(b) 635MW drop in 10 minutes (down 49%)
(c) 698MW drop in 15 minutes (down 53%)
Yikes!
Not well forecast in advance
Today was one of those days that the Control Room people don’t look forward to. With the advantage of our ‘Forecast Convergence’ widget in ez2view at 13:55 we can help to illustrate why…
Gyrations in forecasts for ‘Market Demand’
In this first snapshot , with this snapshot looking at successive forecasts of ‘Market Demand’ in South Australia over the P5 predispatch forecasts showing just how much gyration there was in AEMO’s forecasts for ‘Market Demand’ (and, below this, assumptions about rooftop PV injections):
Frequent readers will recall that this widget is designed so that users can ‘look up a vertical’ in order to ‘see that other dimension of time’.
As illustrated in the notes, it took only 15 minutes for the AEMO’s expectations for ‘Market Demand’ to drop by over 50%!
… that’s not a criticism of the AEMO, by the way, just an illustration of how hard their job can be, from time to time.
Gyrations in forecasts for ‘Wind’
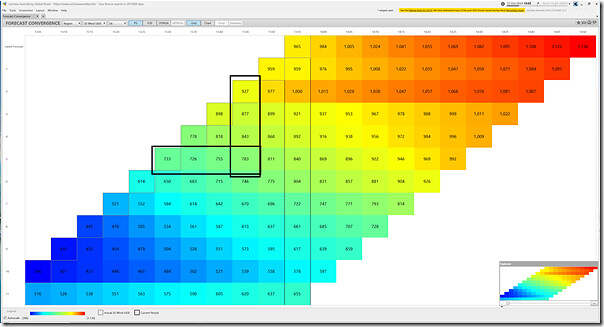
Flipping the toggle to look at the AEMO’s successive forecasts for the aggregate UIGF for all Wind Farms across South Australia, we also see similar uncertainty:
In this case, the aggregate wind yield capability cranked up much more quickly than the AEMO had been expecting just a dispatch interval or two earlier!
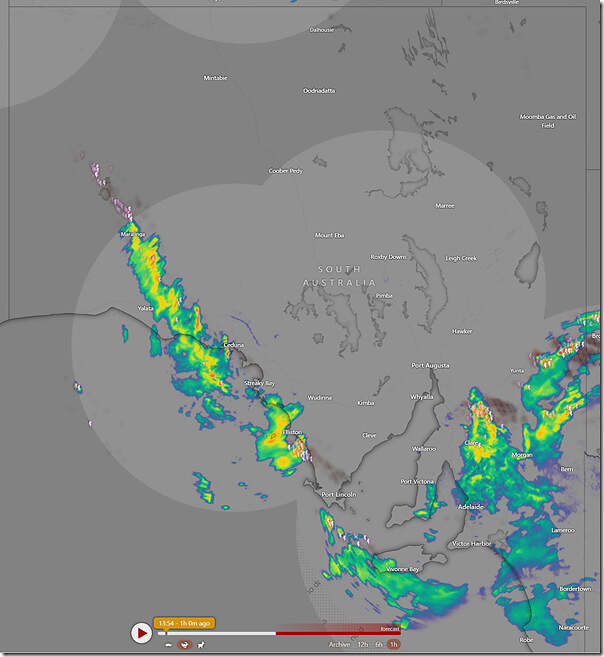
Severe Storms, one culprit
Without falling down that rabbit hole, here’s a snapshot from Windy that paints a picture of (at least one of the) culprit(s):


Be the first to comment on "Riding the roller-coaster in South Australia (on Thursday 17th October 2024)"