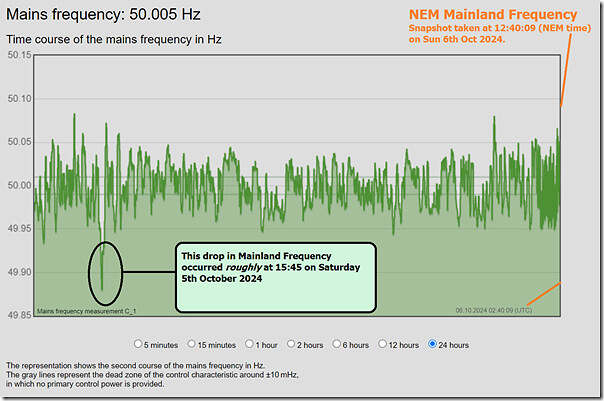
Taking a look at our live dashboard of Mainland Frequency this afternoon (snapshot at 12:40 NEM time on Sunday 6th October 2024, we noticed a drop in system frequency below 49.90Hz (and almost to the bounds of the NOFB) occurring on Saturday 5th October 2024 … roughly in the period 15:40 to 15:50 yesterday afternoon:
Curiosity drove me a little further this afternoon, to see what the cause might have been.
No ‘smoking gun’, in terms of a trip of a coal unit?
Frequent readers here will note that we’ve pre-configured alerts in ez2view (via the ‘Notifications’ widget) to alert some of the team any time a coal unit trips offline – handily sends an email which we can file away for future reference.
A quick reference to the (lack of) such alerts yesterday afternoon around that time made me more curious as to what the cause might have been (i.e. given that, it seemed, on this instance it wasn’t a coal unit).
Three dispatch intervals
So I time-travelled a collage of windows in ez2view back to three dispatch intervals around the time when I thought the frequency drop might have occurred:
The 15:40 dispatch interval
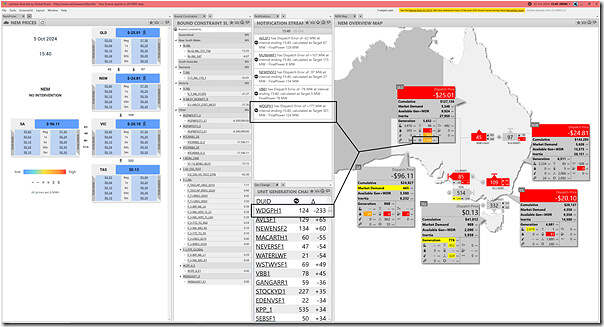
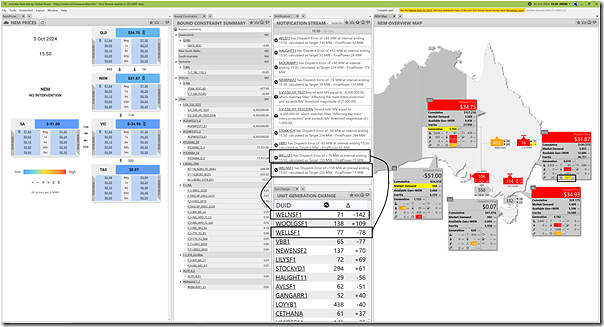
Here’s a snapshot of the 15:40 dispatch interval:
Notable in this snapshot is the large drop in FinalMW at the Western Downs Green Power Hub solar unit (down 233MW … easily the largest drop in any of the DUIDs across the NEM in this dispatch interval):
1) That lights up Solar in QLD as orange (i.e. a –12.83% change in aggregate output);
2) And we also note a Dispatch Error of +177MW (i.e. under-performance) relative to Target.
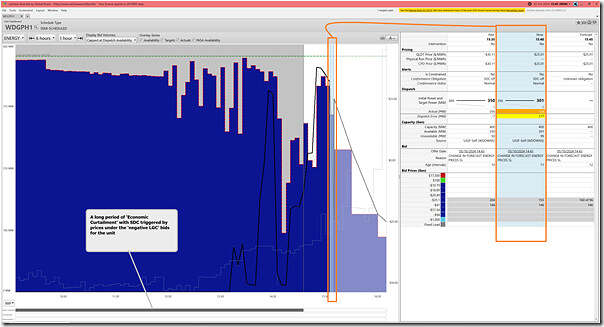
Seeking a bit more context, we drill into the ‘Unit Dashboard’ widget in ez2view for the WDGPH1 unit:
Here we see that:
1) the Semi-Dispatch Cap had been triggered up until the 13:45 dispatch interval (no constraints also bound, so we deduce because of Economic Curtailment),
2) with the unit allowed to ramp from 13:45 with prices climbing (slightly) in the QLD region through the afternoon
3) But a see-saw output profile resulting
… not investigated in detail
4) For the 15:40 dispatch interval we see the Dispatch Error of +177MW shown, with the unit expected to hold relatively steady (i.e. 356MW to 301MW, following the self-forecast Availability), but instead dropping to 124MW … which was both:
(a) the Dispatch Error of +177MW shown; and
(b) the large change in output (-220MW) in the alert.
Notable in the ez2view collage image above is the large negative Dispatch Error for VBB1:
1) Amounting to –78MW,
2) Meaning over-performance relative to Target.
3) This may be FCAS related … have not checked.
The 15:45 dispatch interval
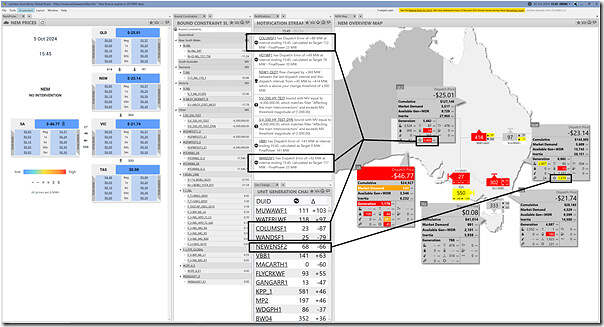
Here’s a snapshot of the next dispatch interval
In this case we see that:
1) Solar in QLD is significantly down:
(a) Notably COLUMSF1
(b) Notably WANDSF1
2) Solar in NSW is also significantly down:
(a) Notably NEWENSF1
3) But some wind elsewhere is up
Notable in the ez2view collage image above is an even larger negative Dispatch Error for VBB1 (-141MW)!
The 15:50 dispatch interval
Here’s the third dispatch interval:
In this dispatch interval aggregate Large Solar in NSW is down.
Notable, again, in the ez2view collage image above is a large negative Dispatch Error for VBB1 (-65MW)!
Aggregate ‘Dispatch Error’ across all Semi-Scheduled units
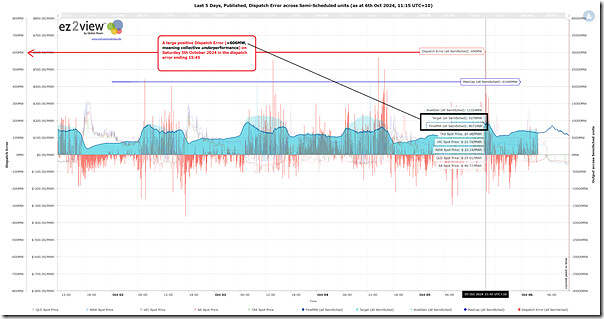
Curious to learn more, I used the ‘Trends Engine’ within ez2view to prepare the following trend of various data series for the current Semi-Scheduled fleet of assets.
The most important series is the aggregate Dispatch Error across all Semi-Scheduled units. We see that:
1) It bounces around a fair bit through the day;
2) Over the time-range shown, the largest deviation (in either direction) was a collective under-performance of +606MW at the dispatch interval ending 15:45 on Saturday 5th October 2024 (i.e. similar in size to a large coal unit tripping … though presumably not as fast as a trip).
To what extent did this contribute to the significant drop in frequency seen at around that time in the snapshot at the top of the article?
A longer series of analysis
Some readers here will remember that we’ve been collating (in GenInsights21 and then into GenInsights Quarterly Updates) a series of analysis about ‘Aggregate Raw Off-Target’ (which feeds from ‘Dispatch Error’) for all Semi-Scheduled units, and sharing some analysis here on this site:
1) Articles pertaining to the long-term trend of AggROT for Semi-Scheduled units are sometimes collated here.
2) There are numerous specific Case Studies as well.
We wonder if the Semi-Scheduled category, as it currently works, is scalable and sustainable?


This is worth a closer look at the rate of roll off of both load and frequency and then a look at satellite imagery for cloud cover. One that people didn’t see coming I suspect. Has already happened a couple of times her in WA where unforecast cloud banks rolled in from the ocean and cruelled rooftop solar production. Chewed up all system spinning reserve and then some.