Way back we we published the GRC2018 we’d written about how ‘the NEM is becoming increasingly dependent on the weather’.
… that was Theme 6 within Part 2 of the 180-page analytical component.
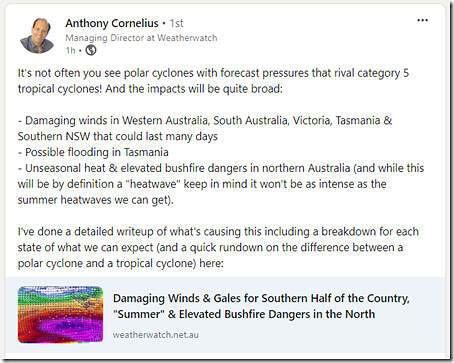
In the (growing!) years since that publication, what we’ve seen has continued to reinforce that notion. So readers will understand my interest in seeing this LinkedIn update from Anthony Cornelius by WeatherWatch:
There are ‘polar cyclones’!?
… I learn something new each day.
That update links through to the article ‘Damaging Winds & Gales for Southern Half of the Country, “Summer” & Elevated Bushfire Dangers in the North’ that provides a lot of context. Amongst the titbits of information, the article talks about …
‘the potential for multiple days of damaging winds and gales to occur. These gales will begin over Western Australia on Saturday and gradually extend eastward into next week. ’
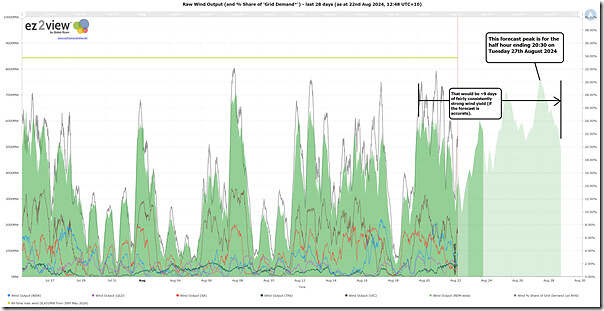
So it was curiosity that I opened up this pre-configured ez2view Trend that focuses on a look-back and look-forward on NEM-wide wind yield. Here’s how it looks as at early afternoon on Thursday 22nd August 2024:
Remember to click on the chart to open a larger view … and that those with a licence to the software can open their own copy of this trend here.
I’ve highlighted on the chart:
1) What could be (if the forecast holds correct) a block of at least 9 days of pretty consistently strong wind yield across the NEM
… a big change from the wind lull of 2024 Q2 which saw doldrums of around that length!
2) The highest point being forecast for the half hour ending 20:30 on Tuesday 27th August 2024.
… which still would be ~1,000MW below the all-time maximum set on 30th May 2024.


Mother Nature trying to average out the wind conditions by reminding us of the power of the wind.
Interestingly wind generation in Victoria in Q3 has continued to perform below average for this time of the year, while SA is close to average. Tasmanian dams and catchments need more rain, but I’m sure they could get by without floods.