
Early yesterday evening I was deeply engrossed in the Olympics coverage when I received a string of SMS alerts notifying me of a rare occurrence of simultaneous price spikes in all five NEM regions – something that I hadn’t recalled seeing very often in my career, outside of the energy crisis in 2022.
Later in the evening.. after the Men’s mountain bike race finished (spoiler alert: Tom Pidcock overcame a punctured tyre in an incredible comeback to win the gold), I fired up ez2view to have a very brief view of some of the macro-dynamics.
Below I’ll share some of the over-arching factors at play last night- and then I’ll finish up by trying to answer the question that I’ve asked in the title of this article.
An early look at some of the factors at play last night
As I noted in my short post last night, spot prices in all five regions jumped above $1,000/MWh starting from the 17:55 dispatch interval yesterday. At the next interval, prices in each region had jumped above $3,000/MWh as shown in the screenshot below.
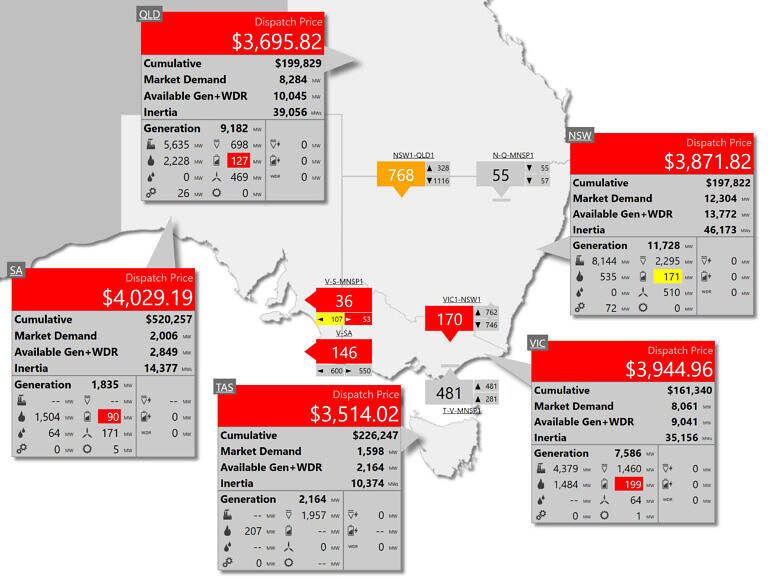
All three mainland AC interconnectors were flowing within limit during the 18:00 dispatch interval.
Source: ez2view’s NEM Map widget
I’ll highlight that the QNI, VNI and Heywood interconnectors were all open (i.e. flowing within limits), whilst Basslink was flowing at its export limit for the specific interval shown. This might initially imply that the four mainland regions formed one economic island, and Tasmania formed another. However, a quick look at the AEMO’s next-day price setter data shows that a single offer from the Victorian Big Battery was involved in setting the energy price in all five regions, including Tasmania, for this interval.
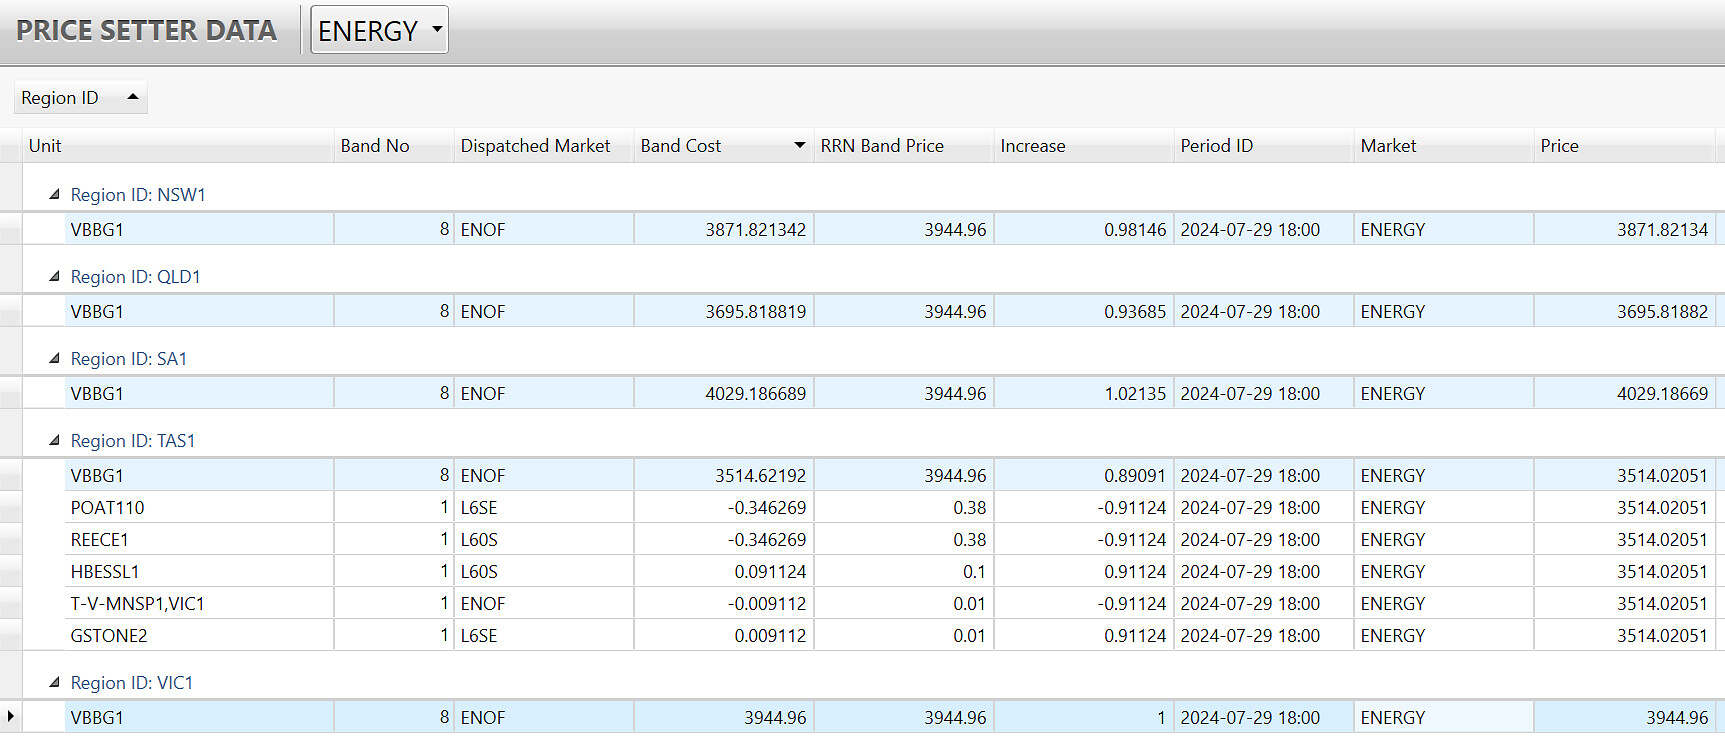
The price setter file for the 18:00 dispatch interval last evening.
Source: ez2view’s Price Setter Data widget
The joys of co-optimisation and the dispatch dynamics of Basslink make deciphering the price-setting situation in Tasmania a little trickier. I won’t delve into that in this article, but I would encourage you to read Allan O’Neil’s introduction to price-setting in the NEM, which specifically explains some of the complexities about Basslink and how inter-regional losses are calculated.
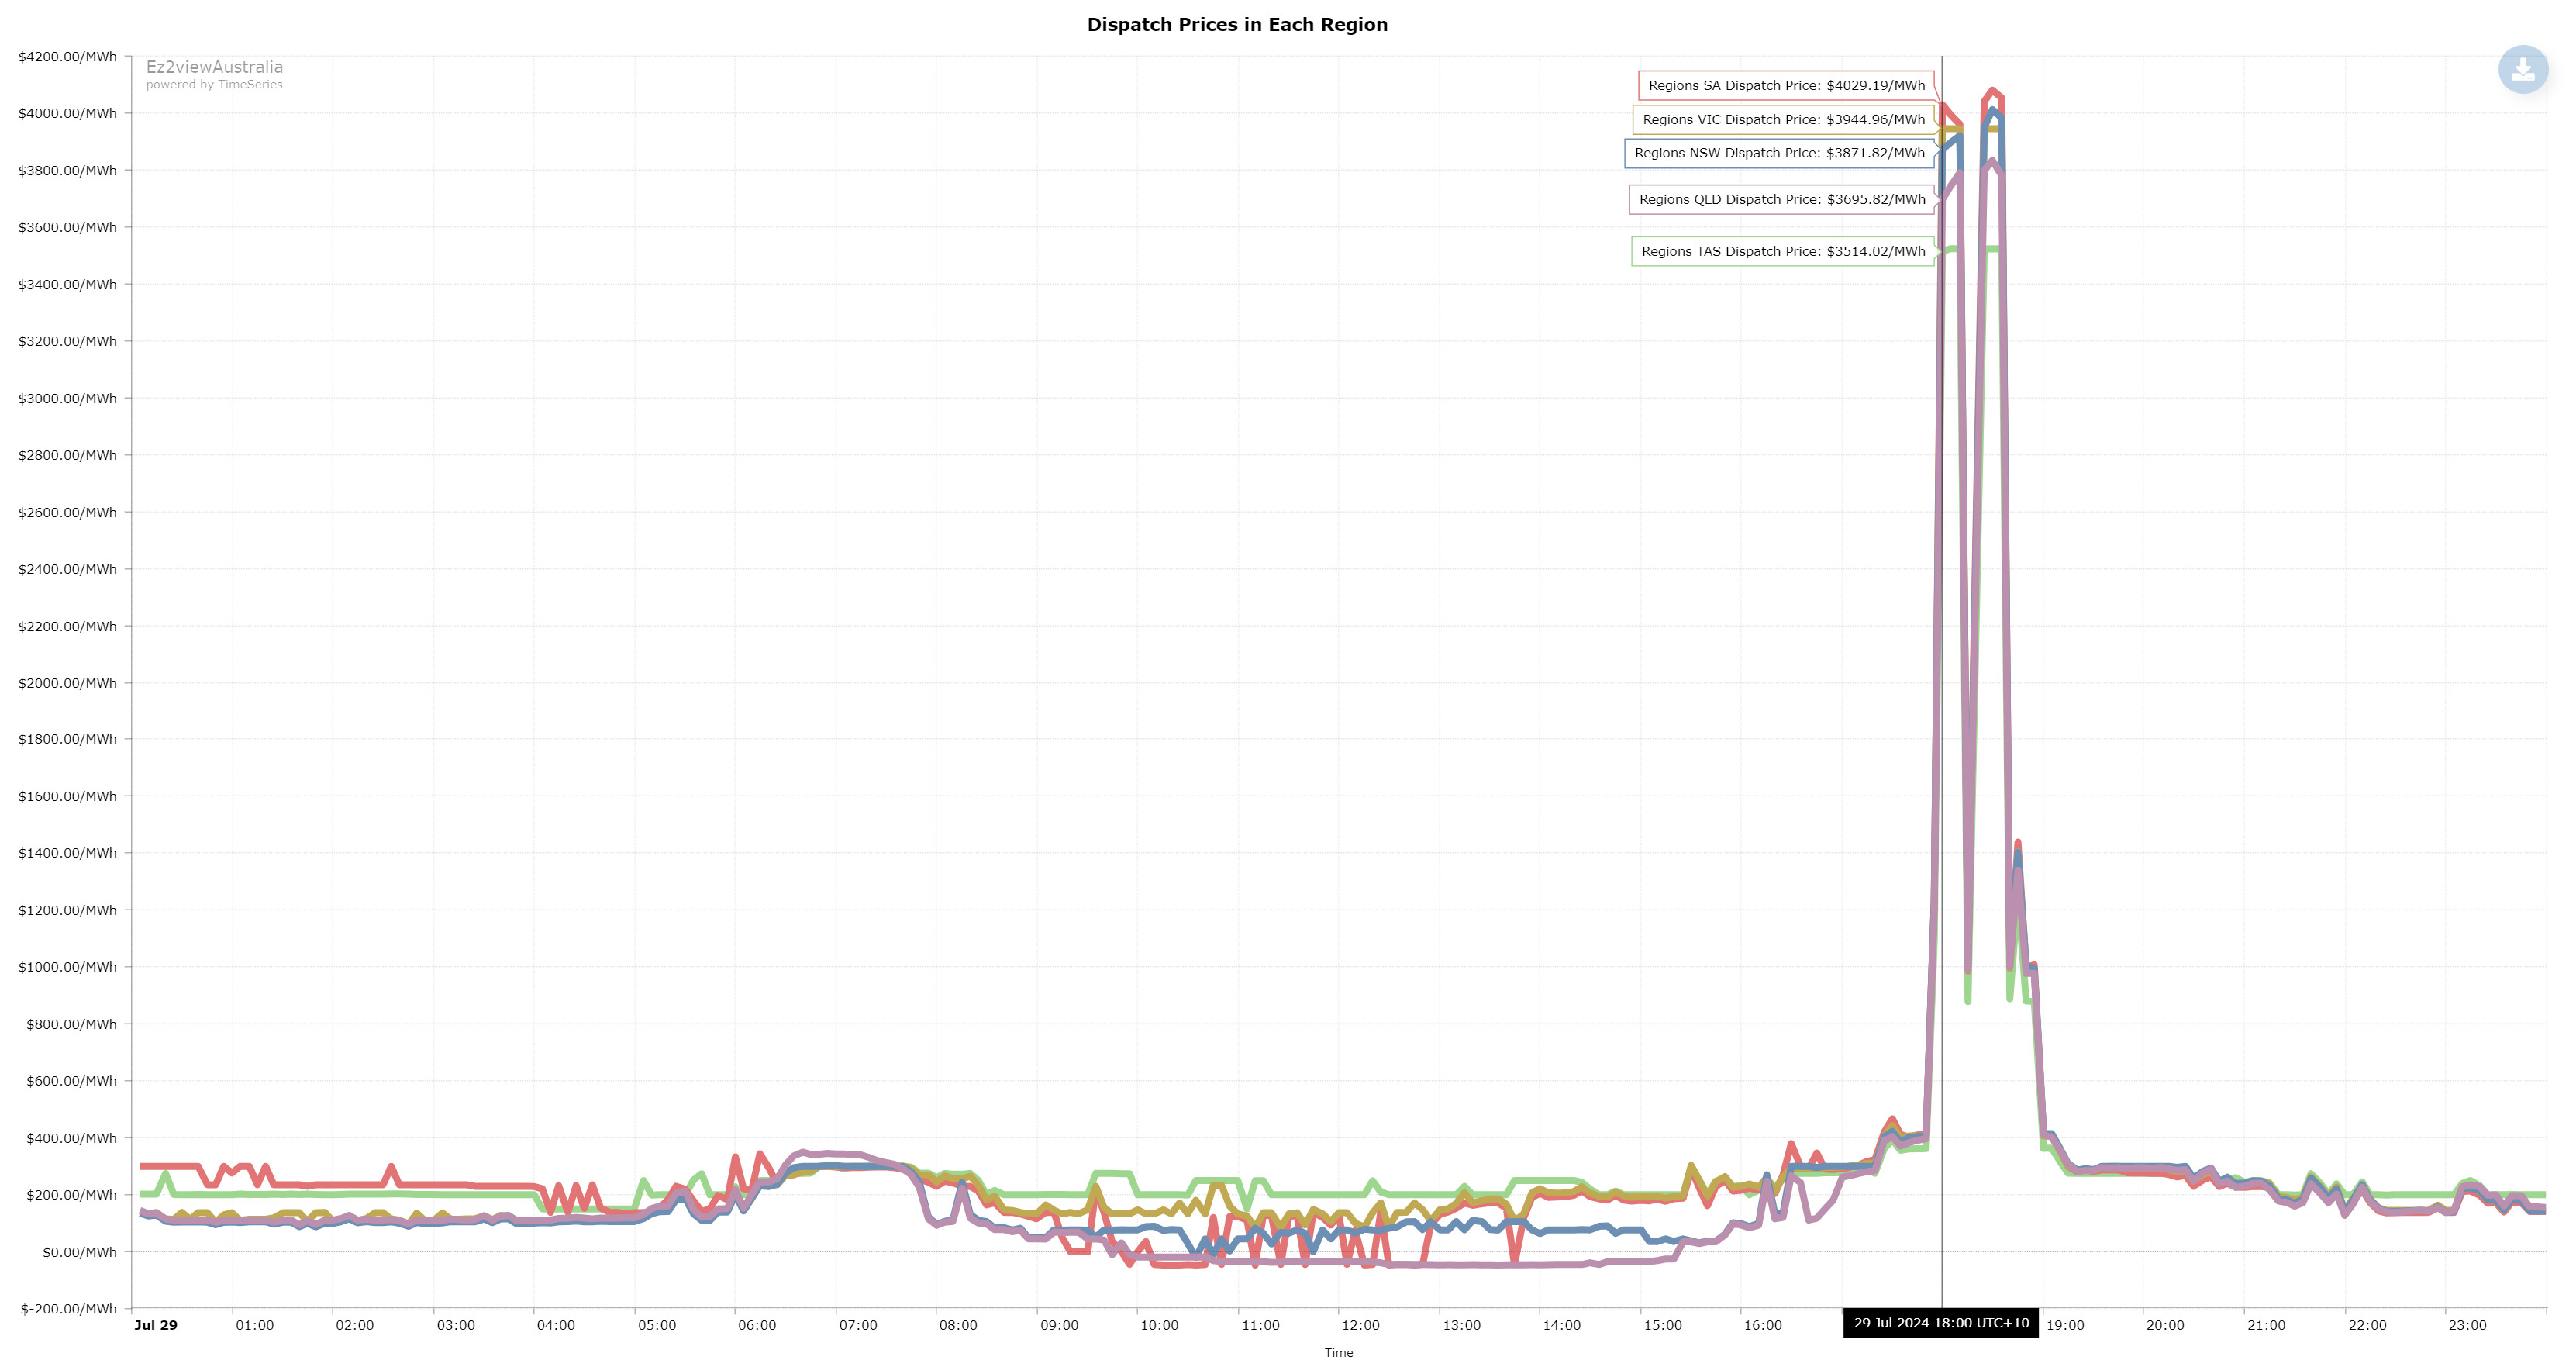
Last night’s price volatility lasted for roughly one hour and was very uniform, by NEM standards. Chart shows the previous 24 hours.
Source: ez2view’s Trend Editor widget
On the demand side, market demand (a.k.a total demand) reached a 7-day high in every region bar TAS yesterday evening. Coincidentally, it was earlier forecast that a new all-time TAS demand record might have been on the cards, but this did not eventuate.
Increased demand for heating was surely a driver to the price volatility, with a prolonged cold snap hitting the south-eastern part of the country. The second chart below shows air temperatures across the five capital cities in the NEM between Saturday and Monday.
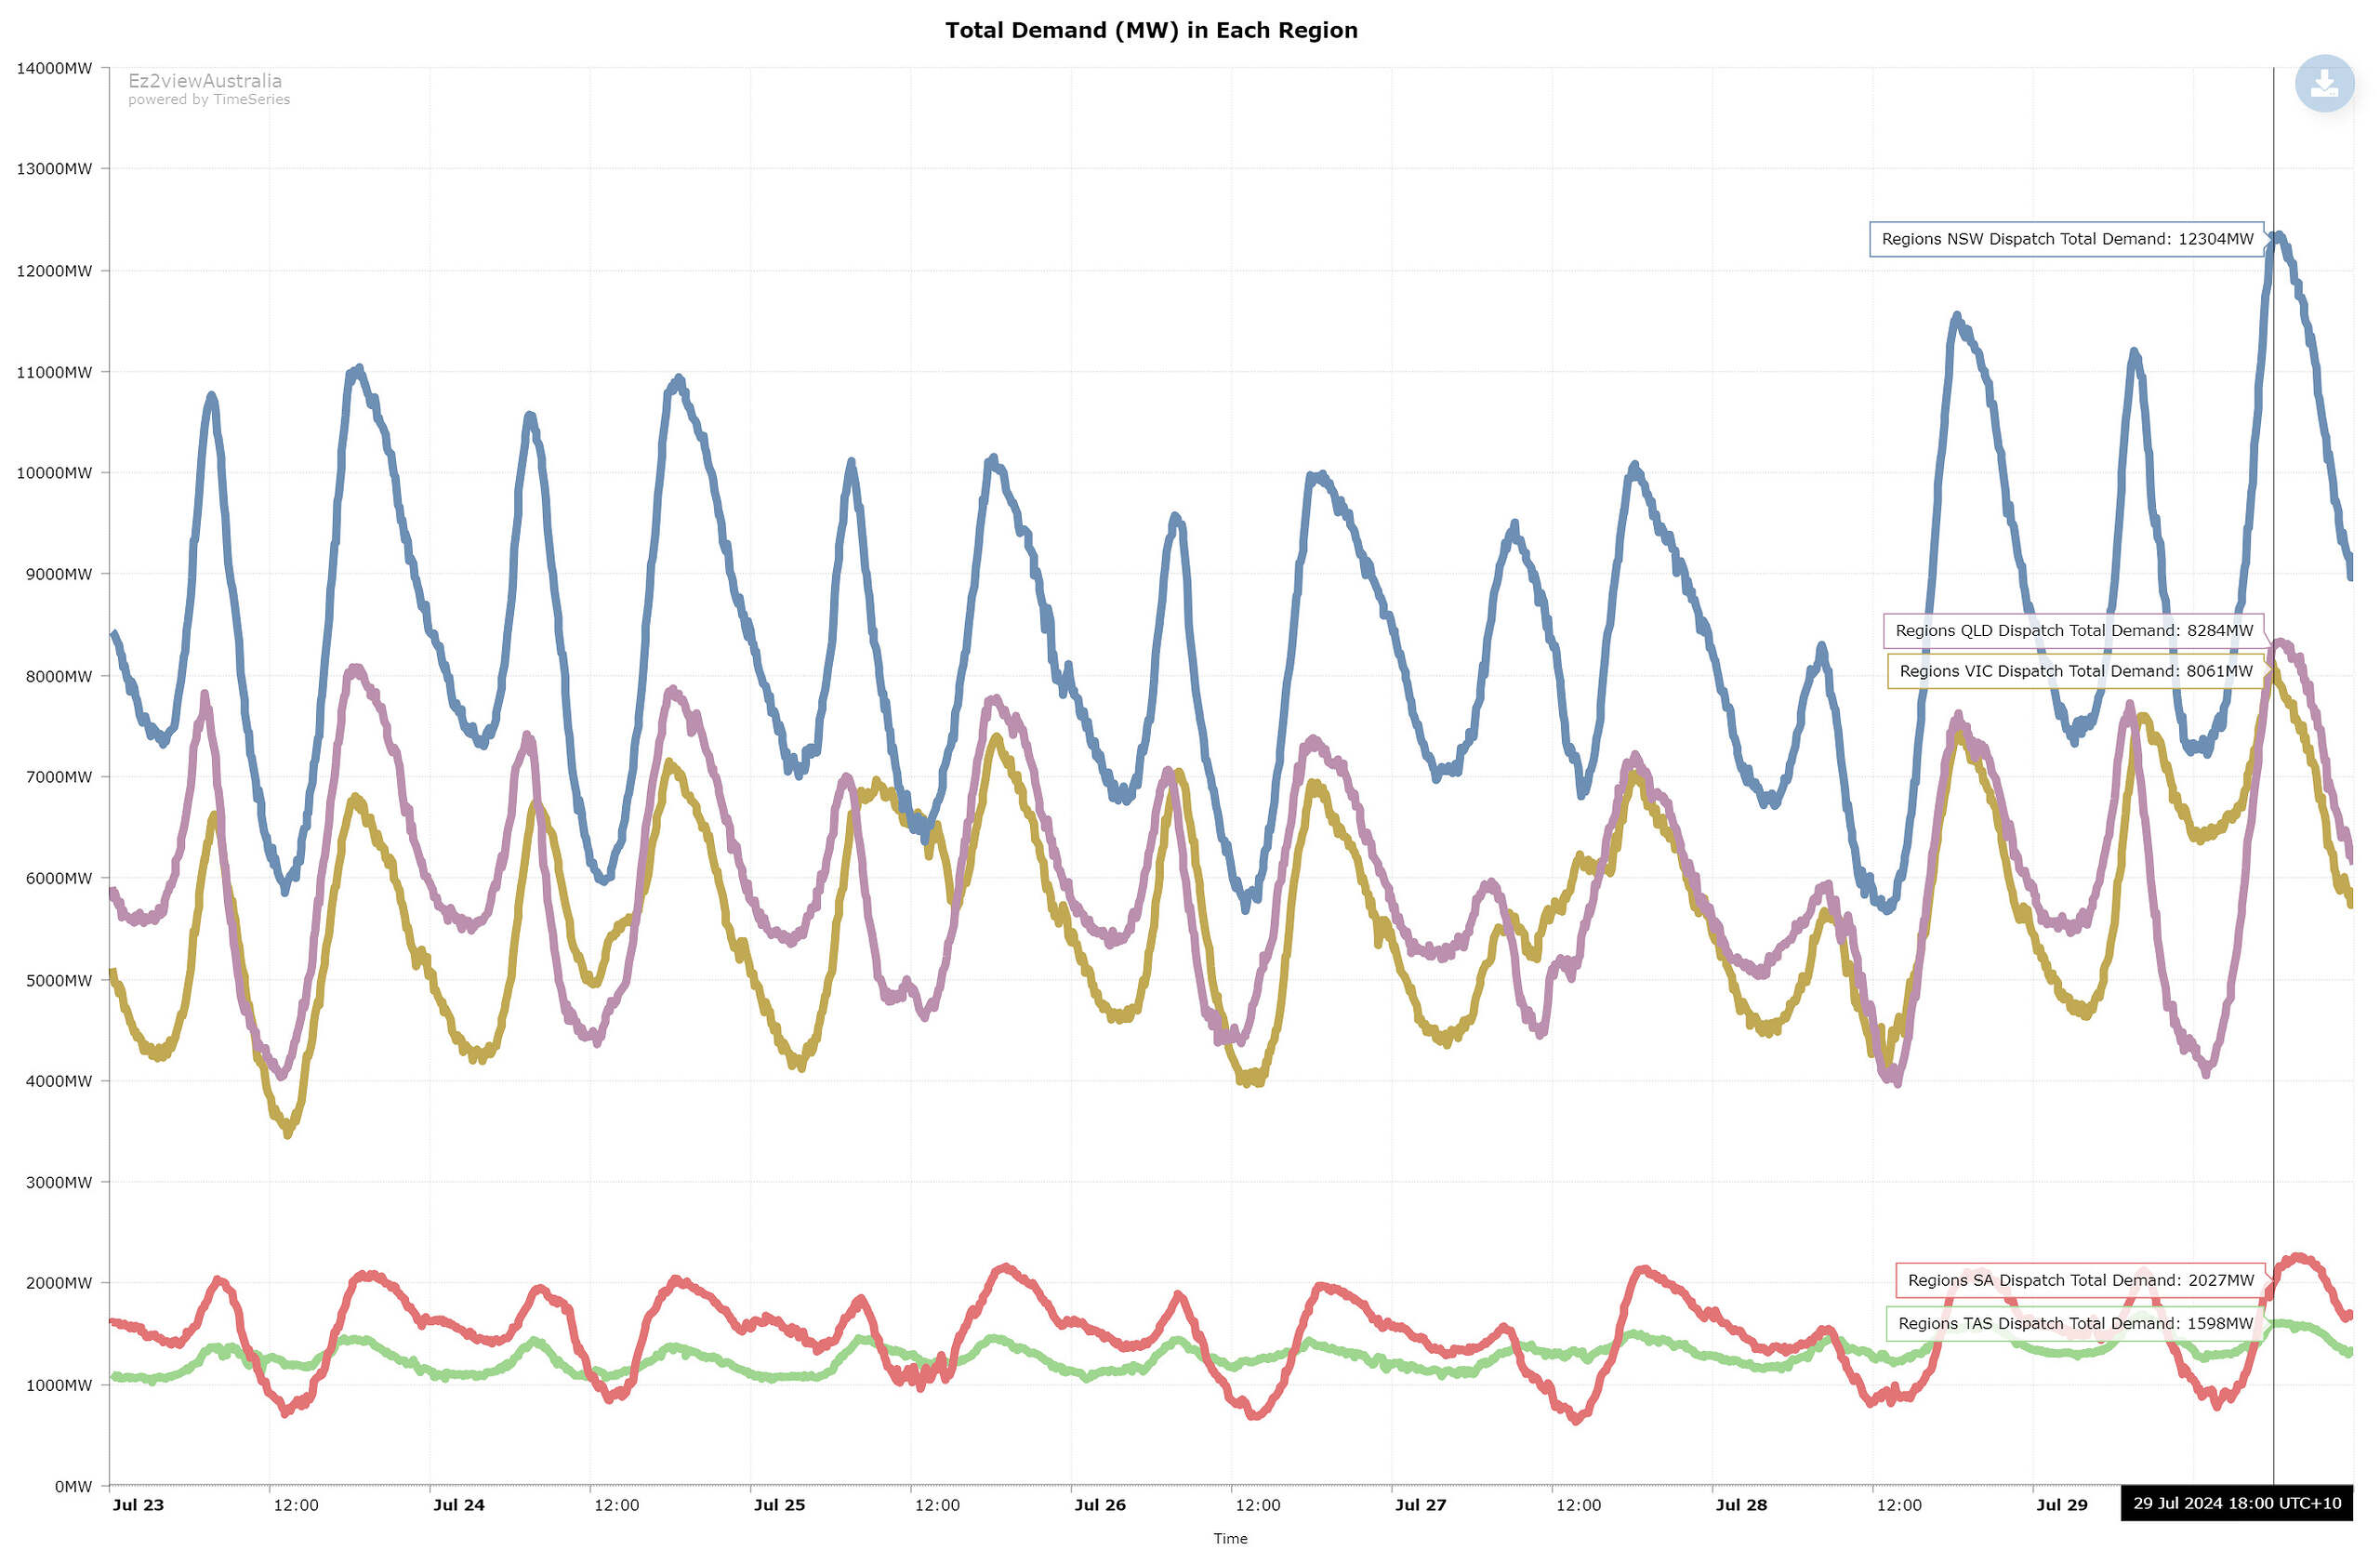
Total demand reached a one-week high in four of the five NEM regions yesterday evening. Chart shows the previous 7 days.
Source: ez2view’s Trend Editor widget
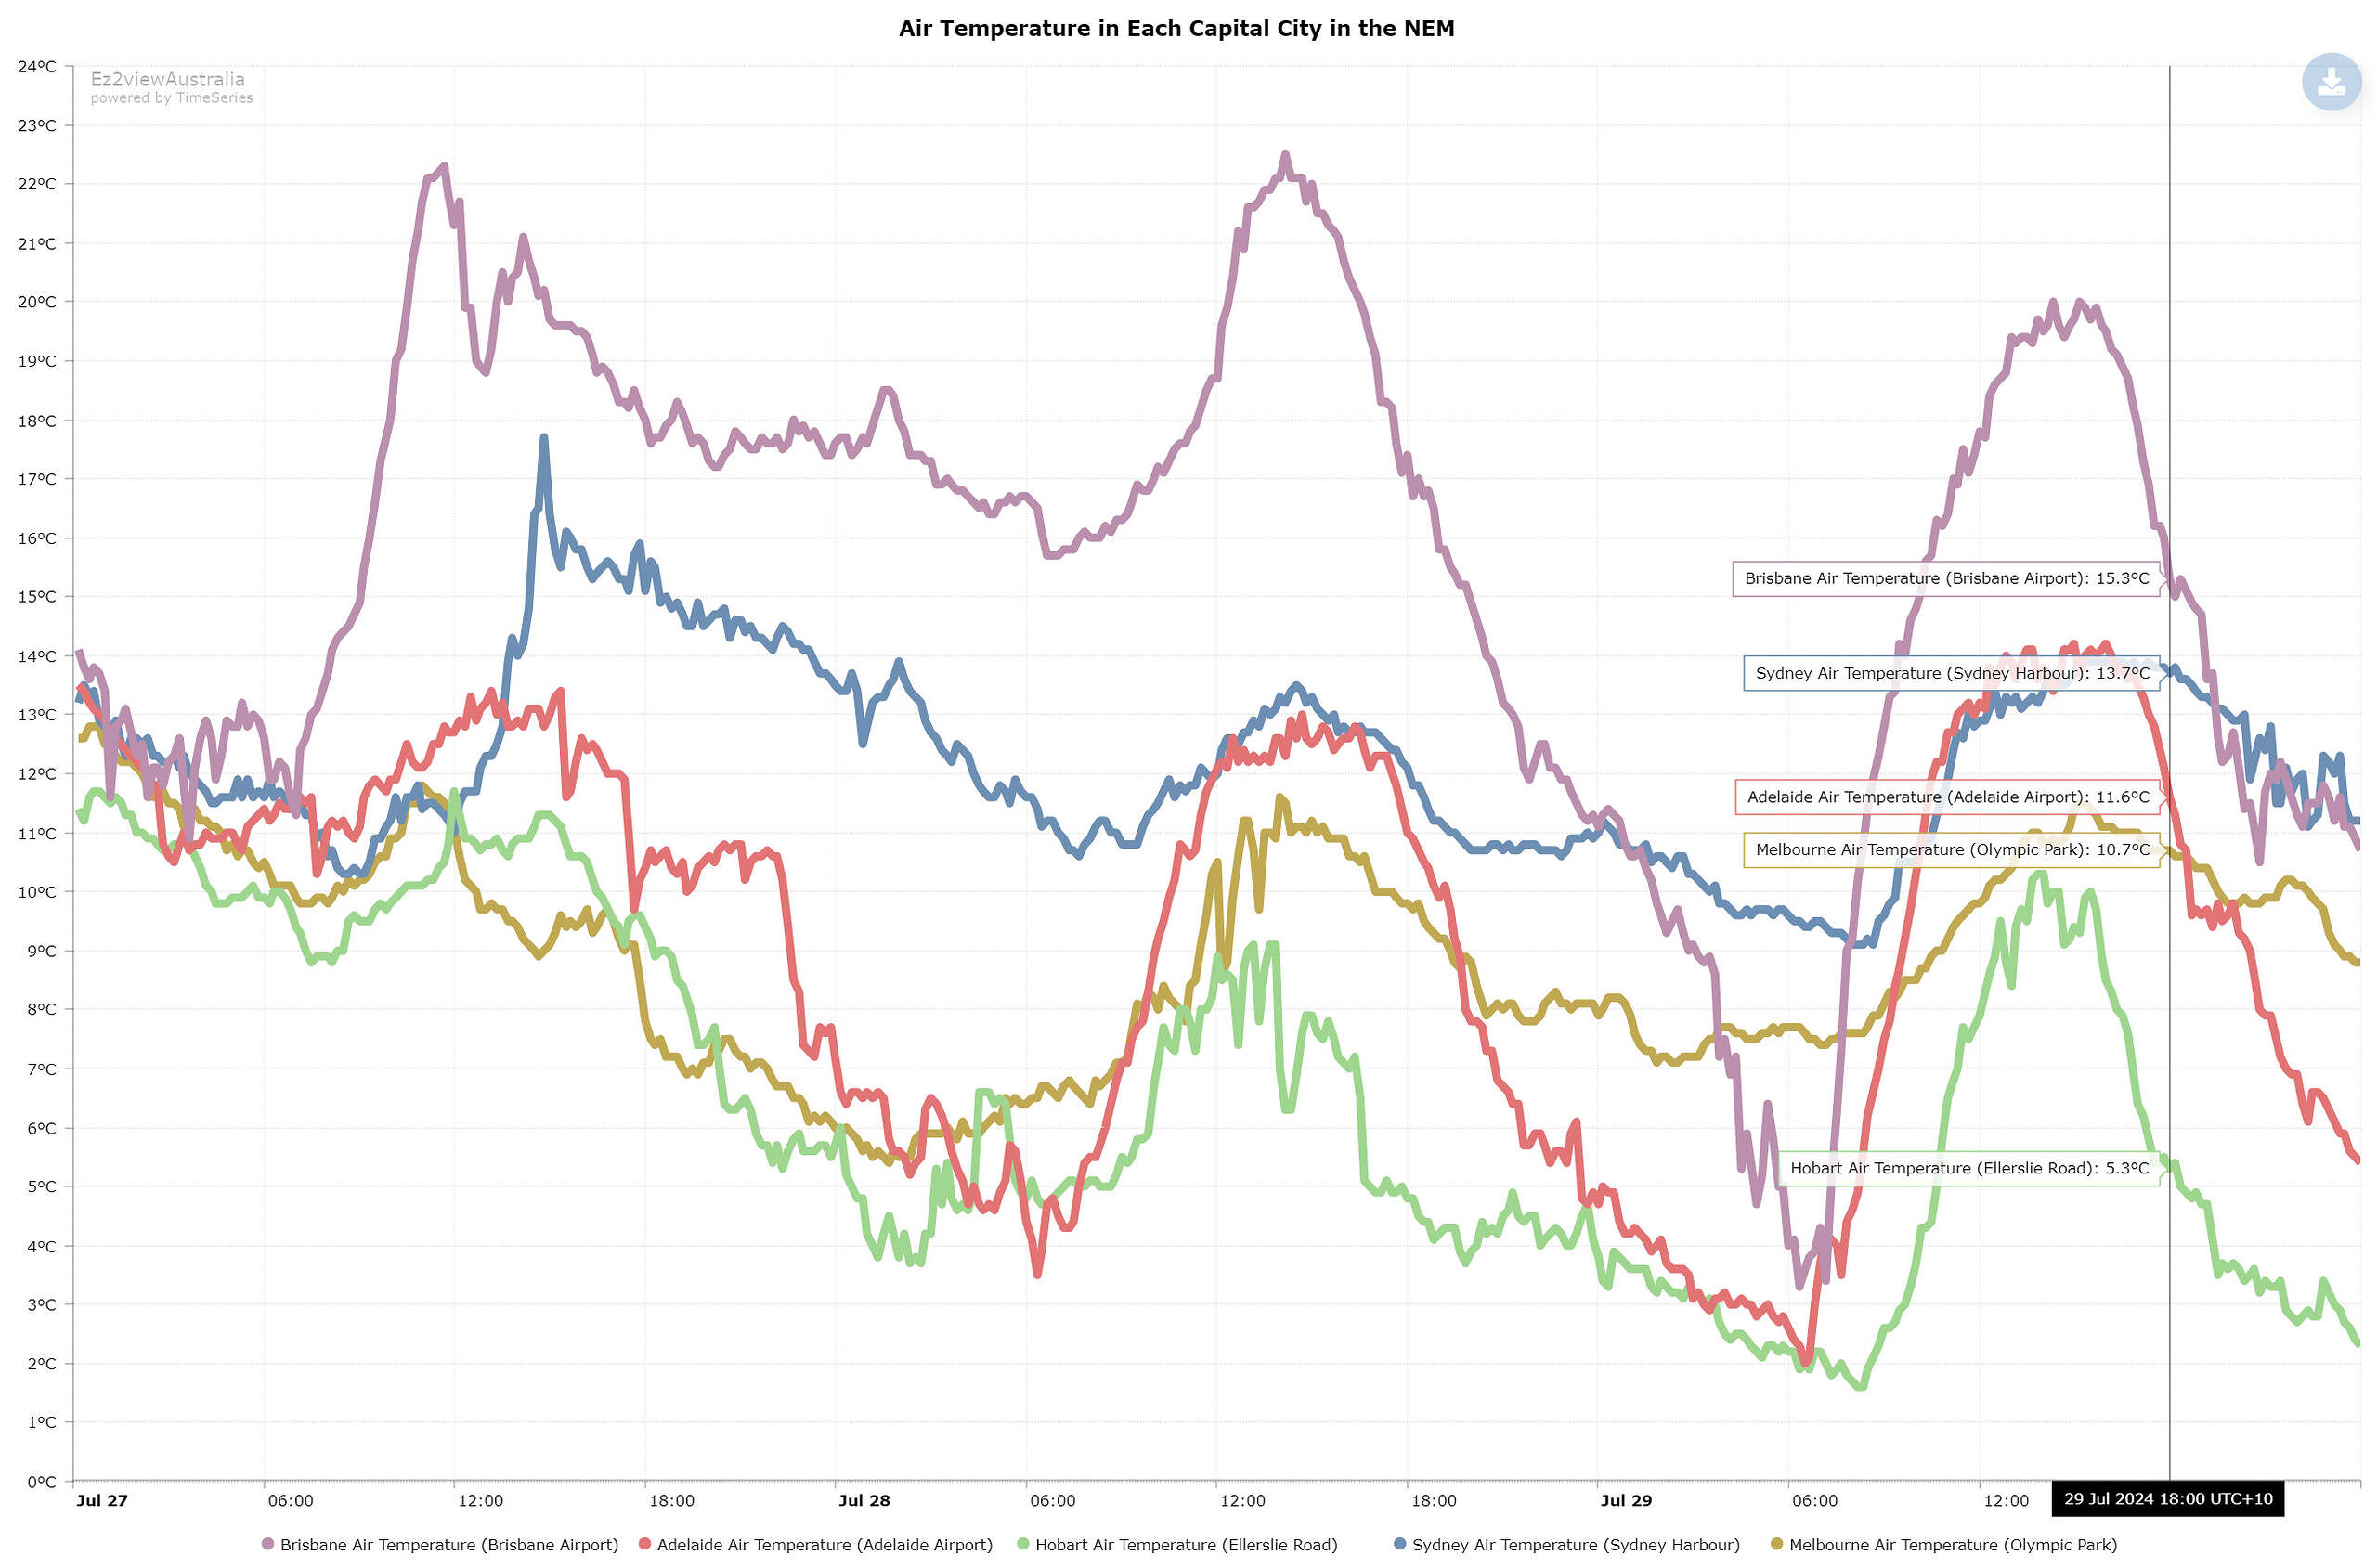
Air temperatures at 18:00 yesterday across the five capital cities in the NEM. Chart shows the previous 3 days.
Source: ez2view’s Trend Editor widget
On the supply side, one significant contributing factor was a relative lack of wind generation in the Southern regions. The chart below shows low wind production in VIC, SA, NSW and TAS coinciding with the early evening demand peak at 18:00. Worth noting that there were a number of constraint equations bound for this interval, particularly in TAS and VIC – as time permits we will attempt to have a deeper look into possible network curtailment amongst the wind fleet.
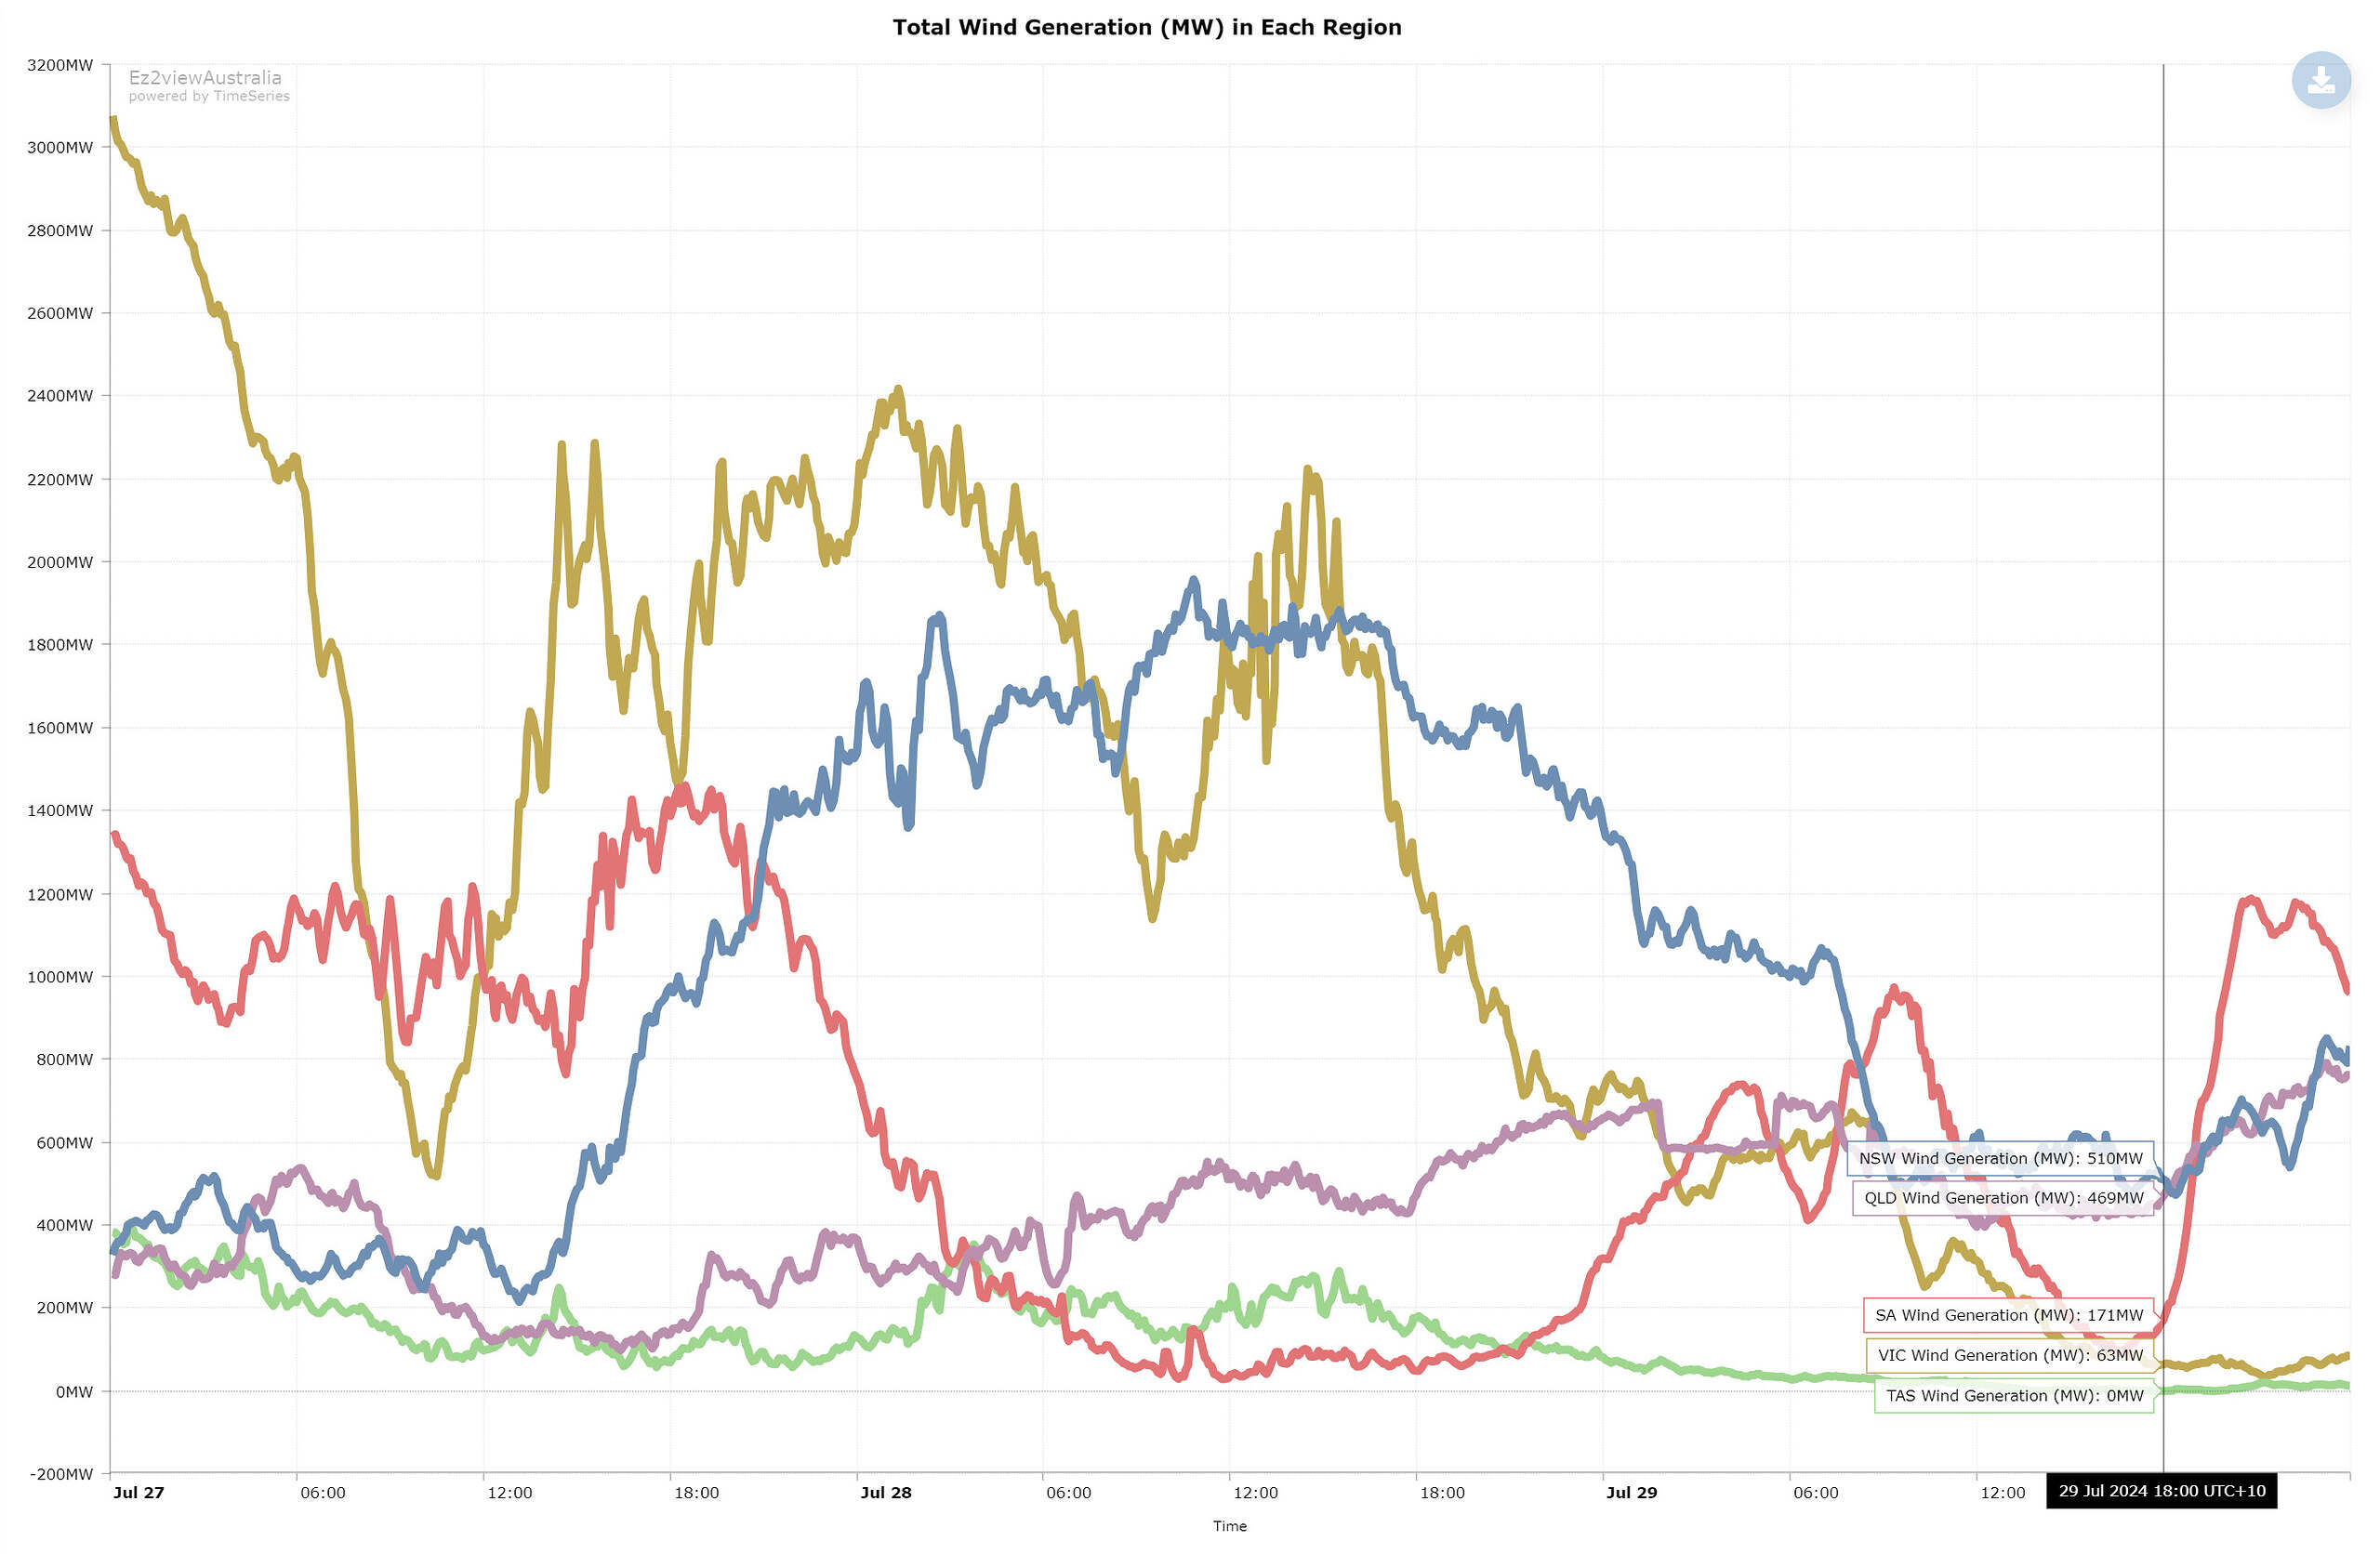
Total wind generation (MW) in each of the five NEM regions. Chart shows the previous 3 days.
Source: ez2view’s Trend Editor widet
There were (and still remains, at the time of writing) a small number of unplanned forced outages amongst the thermal fleet, including outages at Callide Unit C3 (466 MW), Yallourn Unit 3 (405 MW), and Gladstone Unit 4 (280 MW). The long-term outage at Callide Unit C4 (466MW) is also ongoing, given that its return-to-service was recently pushed back once more. The screenshot below also shows a number of planned and unplanned deratings.
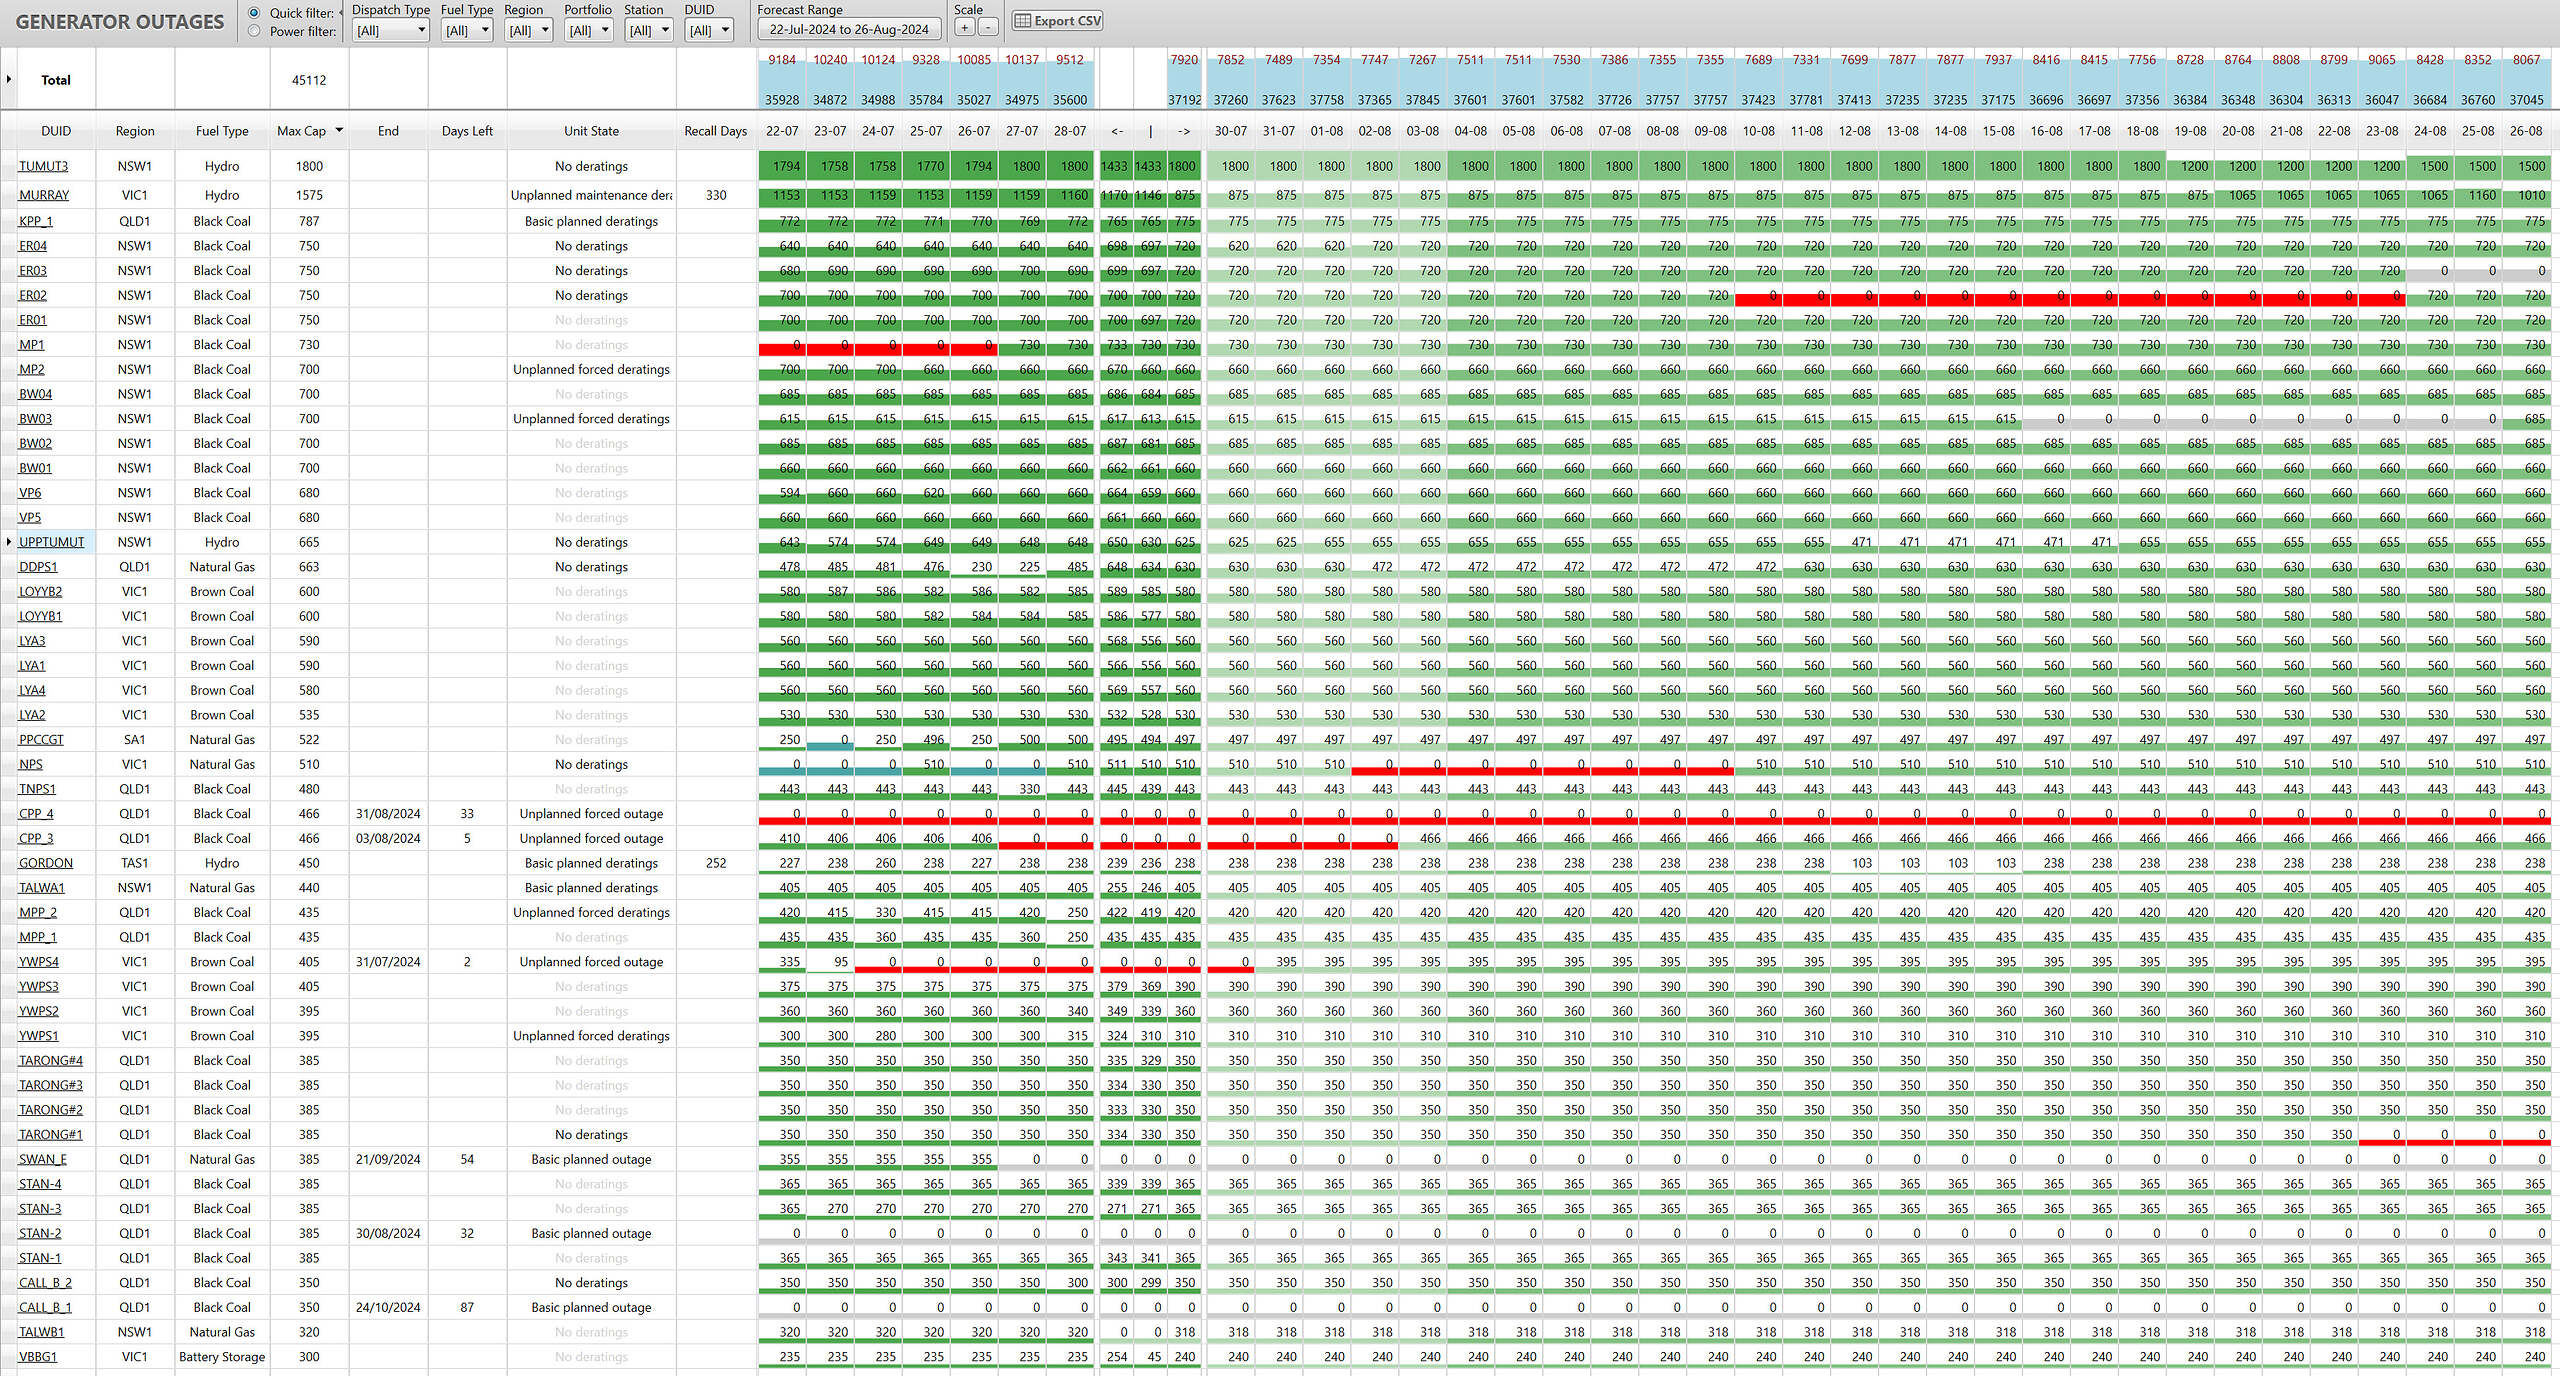
Recent, current and scheduled outages for generating units in the NEM greater than 300MW, as at 18:00 yesterday evening. Ordered by Max Capacity.
Source: ez2view’s Generator Outages widget
How rare are NEM-wide simultaneous price spikes?
Generally when the interconnector(s) between two regions is constrained/flowing at limit, regional prices on either side separate – and hence economic islands form on either side. Supply and demand in each region can vary significantly, so it’s common for multiple interconnectors to be constrained at the same time, where several economic islands form across the NEM. This is the primary reason why simultaneous price spikes in all regions are relatively rare.
Another member of our team was also curious to understand how many times this had happened in the history of the NEM, so we queried our MMS database to fetch the list of all dispatch intervals where every region had a dispatch price > $1,000/MWh.
The historical record shows that this had occurred numerous times between 2001 to 2007. However, interconnection dynamics in the NEM changed dramatically with the introduction of the Tasmanian region in 2005, and the abolition of the Snowy region in 2008. As such, simultaneous price spikes of this nature have only occurred in very isolated incidences since 2007 (outside of the 2022 energy crisis). Below is the full list of occurrences:
- 10th February 2017 16:10
- 7th June 2018 10:20
- 30th May 2021 18:30, 18:35
- 21st June 2021 17:30, 17:40
- 6th July 2021 17:50
- 2nd June 2022 7:00, 7:10, 17:00, 17:15, 17:20, 17:30, 17:35, 17:40, 17:45, 17:50, 17:55, 18:05, 18:10
- 14th July 2022 17:25, 17:30, 17:40
- 29th July 2024 17:55, 18:00, 18:05, 18:10, 18:20, 18:25, 18:30, 18:35, 18:45
So to put that into context, there have only been 32 intervals where dispatch prices were above $1,000/MWh in all five NEM regions simultaneously since 2008 – and of which, 9 of those intervals occurred last night.
—
With prices forecast to be up near the market cap again this evening in all five regions, we will be keeping an eye on the market again tonight to see if a repeat occurs.
Leave a comment