Yesterday we posted ‘A first quick look at bids for NSW participants, including Wednesday 8th May 2024’ – including (amongst other things) an aggregate level view of Wind Farm bidding in NSW, looking back 30 days.
In this article we’re going to narrow the date range (i.e. back 4 days from 04:00 this morning, Friday 10th May 2024) – so both:
1) extending more than 24 hours into the ‘NSW under Administered Pricing’ regime,
2) but also spanning the volatile periods of Tue 7th May evening, Wed 8th May morning, and Wed 8th May evening.
We’re still using the ‘Bids & Offers’ widget in ez2view.
(A) All Wind Farms across NSW (17 stations)
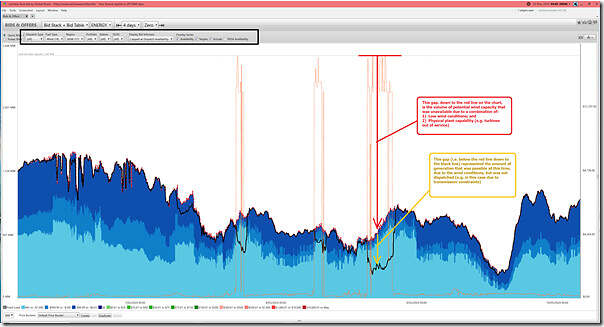
If I have counted correctly, there are 17 x Wind Farm (stations) in NSW via this filter currently – here’s the shorter time-range aggregate view:
When we’d looked back over 30 days, the suspicion had been that the volatility in the market had been boosted as a result of wind capacity that was ‘constrained down’ during the volatile periods. In this narrower time-frame view, it’s clear that:
1) The total volume of wind harvest possible was 1,600-1,900MW lower than the theoretical maximum capability of the installed capacity base, due to lower-than-ideal wind conditions;
2) But on top of this, there was latent wind generation capability that was ‘spilled’ … presumably because of transmission constraints (i.e. all bids are in the blue range, so – especially during the clear periods of volatility – none would be ‘out of the money’).
So there’s clearly two different factors at work.
(B) Unbundling, for each of the NSW Wind Farms
There’s too many for me to illustrate individually, so I have manually sorted and think
B1) Wind Farm units that were ‘constrained down’
We earlier posted ‘A quick look at the ‘N::N_CTYS_2’ constraint equation, with respect to Wednesday 8th May 2024’, in which we noted that there were a number of NSW-based Wind Farms that were ‘constrained down’ by this constraint … but keep in mind that there were other constraint equations that were also bound (so it’s not only this one that was a factor!)
How much energy was spilled as a result (of this, and other, constraints)?
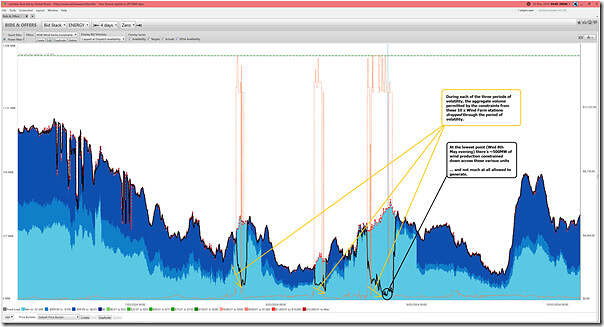
Using the the ‘Bids & Offers’ widget in ez2view, but filtering to just the sub-set of Wind Farms in NSW that were seen (in my quick scan) to be constrained by any constraint equation through this 4-day window, we see the following:
Note that there are 10 x Wind Farms that have been added to this filter (Bango 1 & 2, Boco Rock, Collector, Crookwell 2, Crowlands, Gullen Range + Biala, Gunning, Rye Park) based on a quick scan – so not 100% fool proof.
So what can we note here:
1) In each of the 3 periods of volatility there’s a substantial volume of energy ‘constrained down’
2) Through each of these 3 periods, the aggregate dispatch gets worse as the period of volatility continues (presumably because the constraints bind more severely)
3) From ~18:10 on Wednesday 8th May, the constraints are severe enough such that only 20-30MW is allowed of production
4) At this low level, it means that by 19:55 there’s over 500MW of wind farm energy being spilled.
So not insignificant at all, given it was all priced at $0/MWh or below…
B2) Wind Farm units that were not ‘constrained down’
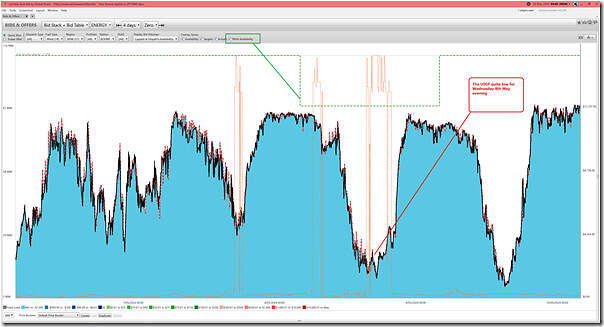
Without adding in much in the way of commentary, here’s the other 8 x Wind Farm stations…
#1 Bodongora Wind Farm
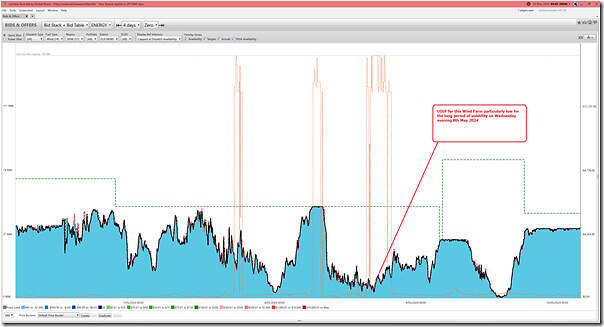
This snapshot shows that the UIGF dropped for the volatility on Tuesday 7th May evening, and particularly for Wednesday 8th May evening … but was reasonable for Wednesday 8th May morning.
Why the PASA Avail dropped for almost a full day is a curiosity that has not been explored.
#2 Crudine Ridge Wind Farm
With this wind farm we see the UIGF dropped for Wednesday 8th May evening:
Outside of the volatile periods, for some periods of time the bid price was dropped to –$1,000/MWh for reasons not explored.
#3 Flyers Creek Wind Farm
With this wind farm we see the UIGF dropped particularly low for Wednesday 8th May evening:
For this Wind Farm the PASA Avail jumped up and down through the 4 day period, for reasons that have not been explored.
#4 Sapphire Wind Farm
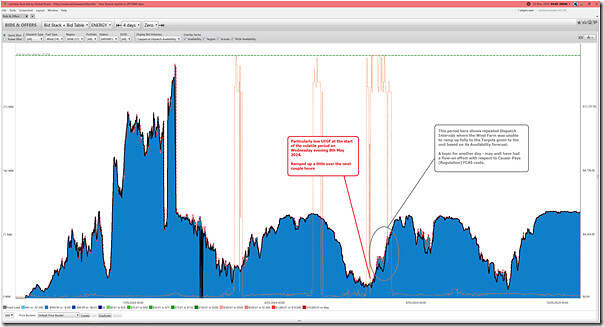
With this wind farm we see the UIGF dropped particularly low for the start of the volatile period Wednesday 8th May afternoon, but ramped up somewhat over the next couple of hours:
However that there’s also a period during Wednesday evening’s volatile period where the unit was unable to output to the levels prescribed in its target. That’s what the dotted grey lines in the chart show (note that this is much more severe in the case of White Rock … below).
#5 Silverton Ridge Wind Farm
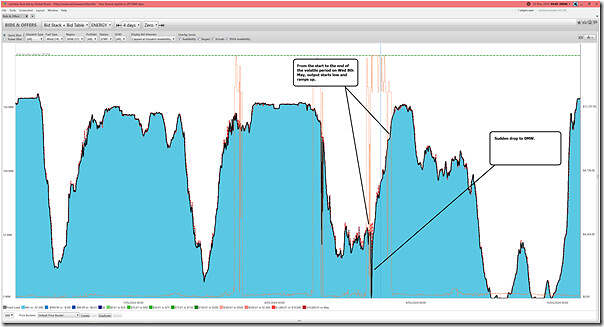
This wind farm is the one that shows the best output profile (in the bunch here) with respect to the periods of volatility over Tuesday 7th and Wednesday 8th May:
Whilst output was initially low when the volatility started on Wednesday 8th May, it did ramp up significantly by the end.
Separately, there’s a sudden drop to 0MW at about 16:25 that is unexplored at this point?!
#6 Taralga Wind Farm
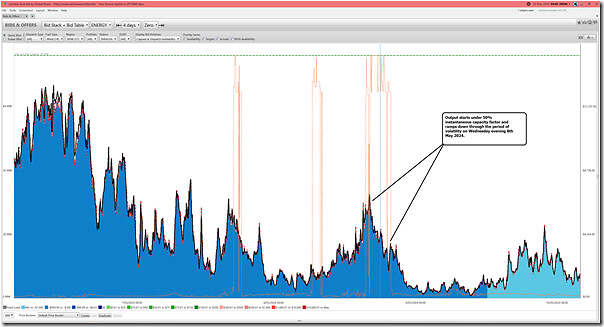
In contrast to Silverton (above), we see output from this Wind Farm ramped down through the period of volatility on Wednesday evening 8th May 2024 (after starting below 50% instantaneous capacity factor in the first place):
Not sure why the bid changed to be –$1,000/MWh from around the middle of the day on Thursday 9th May?
#7 Woodlawn Wind Farm
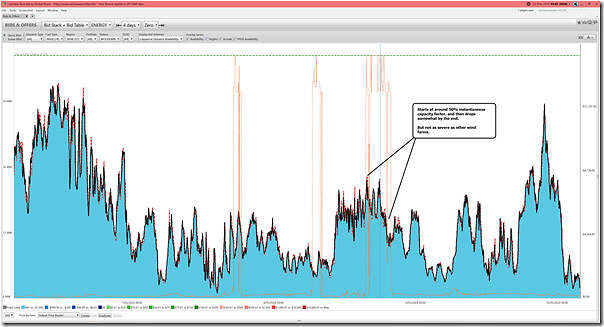
With this wind farm, output during the period of volatility on Wednesday evening 8th May 2024 starts around 50% instantaneous capacity factor and drops slightly:
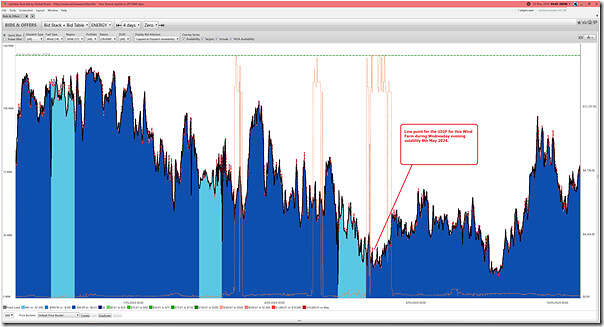
#8 White Rock Wind Farm
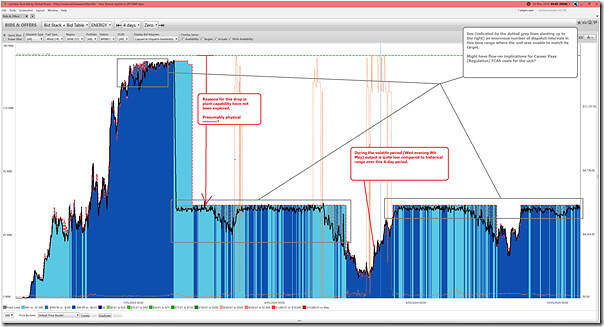
With this wind farm, output during the period of volatility on Wednesday evening 8th May 2024 starts low and rises … but seems to be suppressed lower by some form of plant limitation that’s not been explored?
However it’s also worth noting that (over the 4 days shown) there are an enormous number of dispatch intervals in which the unit was unable to output to the levels prescribed in its target:
1) That’s what the dotted grey lines in the chart show.
2) This may well have had significant Causer Pays (Regulation) FCAS cost impacts?
Reasons for this have not been explored.


It seems that the answer would be some storage, perhaps 15-20% of windfarm peak capacity for two to three hours on the upstream side of the transmission constraint and a similar amount of storage near the loads. The load end storage limits peak demand on the transmission and the generator end limits both economic and transmission based curtailment