Last Thursday, the 8th of February 2024, AGL published their half-year results for the 2023/24 FY. The announcement includes news of a $399m interim profit for these six months, and a tripling of their interim dividend to 26c/share. The company’s share price jumped 10.3% on open last Thursday.
That same day, RenewEconomy interviewed AGL CEO Damian Nicks, and reported on the company’s success in battery project investment, specifically highlighting the strong revenues of their newly constructed 250MW Torrens Island BESS.
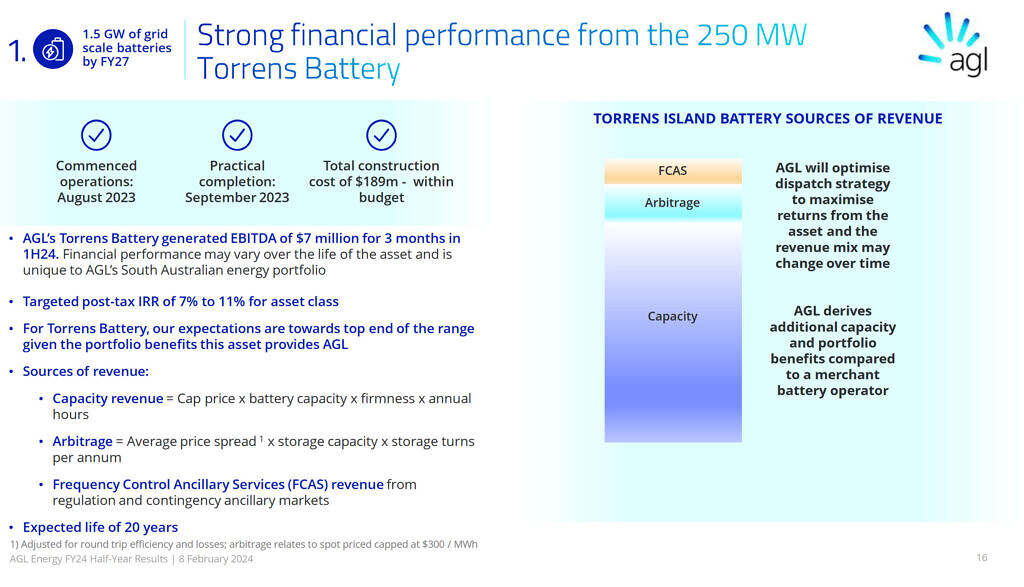
Digging a bit deeper, I have extracted the image below from AGL’s accompanying results presentation, which states that EBITDA for the project was $7m “for 3 months in 1H24”. The sources of revenue for this battery are broken down into three categories: FCAS, Arbitrage, and Capacity – with the latter making up the vast majority of revenue generated from the project.

AGL’s Half-Year Results Presentation highlighted a ‘strong financial performance’ from the Torrens Island BESS
– but with only a relatively small proportion of the revenue directly through the NEM’s Energy or FCAS markets.
Source: AGL FY24 Half-Year Results Presentation
Using our soon-to-be-released GSD2023 to retrieve market revenue data, I can fill in some of the blanks here:
- Torrens Island BESS FCAS Revenue July to December 2023 = $1.21m
- Torrens Island BESS Spot Energy Revenue (i.e. ‘Arbitrage Revenue’) July to December 2023 = $2.39m
I have calculated those numbers by combining the figures for each of the generation and load DUIDs for the Torrens Island BESS, as published in our GSD.
The somewhat-obscure graph within AGL’s presentation suggests that somewhere around 80% of the battery’s revenue was not directly through the transparent spot market, i.e. revenue generated by being dispatched for energy or FCAS. The specific source of this ‘Capacity’ revenue is a mystery … but one we are very curious about, as:
1) From our initial investigations, I can’t find any data that suggests that the battery is part of the System Integrity Protection Scheme (SIPS) in South Australia;
2) The wording ‘AGL derives additional capacity and portfolio benefits’ in the presentation suggests that the added value is more holistic;
3) So perhaps one of our more learned readers can clarify, or point me to any announcements in the public domain, to help me understand the nature of this ‘Capacity’ Revenue, and what specifically is getting accounted for here?
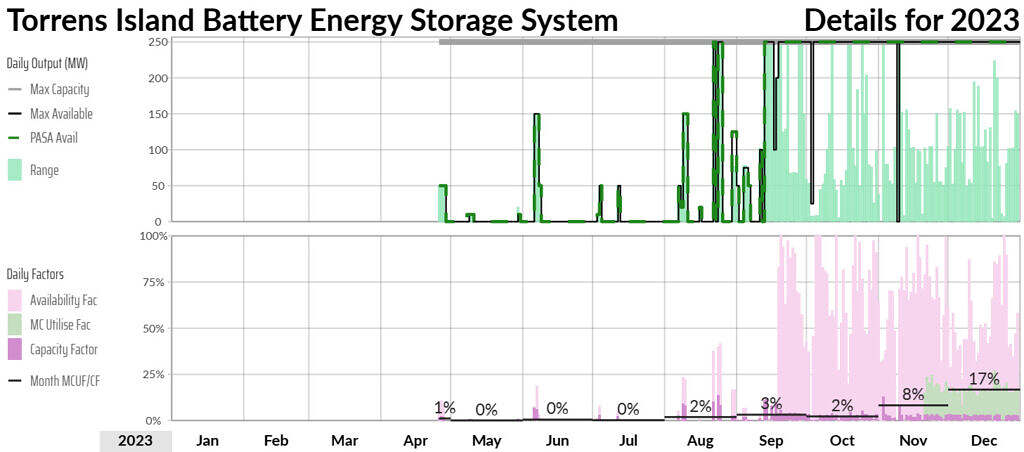
In any case, I will note that the battery spent the majority of 2023 in commissioning – which would have an impact on its opportunity to generate FCAS and Energy revenue, and maybe, Capacity revenue, depending on the nature of this revenue source.

Output data and daily factors for the generation component of the Torrens Island BESS in 2023. With production ramping up in the final months of 2023.
Source: GSD2023
Note that this is an extract for the ‘B’ Page of the TIBG1 DUID (p1153 or 1194 in the GSD2023), which is the supply-side unit (at least until two-becomes-one with the IESS implementation in June 2024).
There’s a similar or the ‘B’ Page of the TIBL1 DUID (i.e. the consumption-side unit) that’s not shown here.


It reads similarly to how the University of Queensland accounted for the performance of their St Lucia BESS, where a significant source of revenue was the cap contracts they were able to forego as a result of being able to manage their own risk with the BESS.
Capacity revenue maybe from
“
The latest tender with Victoria and South Australia will target 600 MW of dispatchable capacity with 4-hour equivalent duration across the two states, in line with the Australian Energy Market Operator’s 2022 Integrated System Plan.
Bringing this new generation online will help cover the loss of capacity from the scheduled closure of South Australia’s Torrens Island B power station in 2026 and the 2028 retirement of Victoria’s Yallourn Power Station.”