As noted in some conversations with clients recently, it seems there’s been some distractions in the market thus far in summer 2023-24 (hence a number of articles on WattClarity) … but on reflection these distractions have been mostly centred on QLD:
1) Frequent readers here will remember that QLD experienced a massively larger all-time maximum demand on Monday 22nd January 2024.
… there’s a number of questions we have been puzzling over about this (will endeavour to post about this soon)
2) It’s removed from the NEM and so not our core focus, but we did notice that the South-West Interconnected System (SWIS) in WA also experienced an all-time maximum demand on Wednesday 31st Jan 2024 (i.e. yesterday)
(a) as noted here by AEMO on Twitter for Wed 31st Jan 2024.
(b) but then … as an in-line PS … superseded on Thu 1st Feb 2024 as subsequently noted here by AEMO on Twitter.
The rest of the NEM, however, has been pretty lacklustre – in terms of levels of demand being reached. So much so that it was not a surprise to see Anthony Sharwood asking ‘When will Melbourne have a ‘real’ summer?’ on Weatherzone on Monday 29th January 2024!
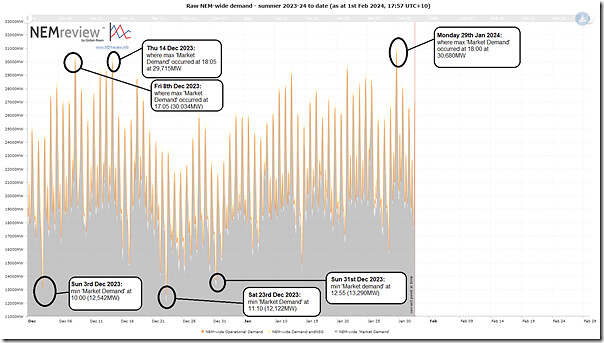
A couple times in writing about what’s been going on I’ve wondered how the NEM-wide demand has been tracking, but have not (till now) had time to trend. However curiosity got the better of me this evening and I opened up NEMreview v7 to produce this trend:
Those with a licence to the software can open their own copy of this query here.
With respect to this chart all stats quoted are ‘Market Demand’, and at ‘NEM time’ (i.e. UTC+10, or Brisbane time):
1) On the trend I have highlighted three high points and three low points:
(a) The high points are as follows:
i. Fri 8th December 2023 saw a highest point at 30,034MW at 17:05 … on a day where we wrote that ‘NEM-wide ‘Market Demand’ peaks above 30,000MW on Friday 8th December 2023 … first time since July’.
ii. Thursday 14th December 2023 saw a highest point of 29,715MW at 18:05 … a day that saw forecast LOR2 and RERT contracted in NSW.
iii. Notably, Monday 22nd January 2024. was not highlighted here:
… the highest point for NEM-wide ‘Market Demand’ was 27,184MW at 17:45, despite what happened in QLD!
iv. Highest point (to date) was on Monday 29th January 2024 with ‘Market Demand’ reaching 30,680MW at 18:00.
… one of the days seeing evening volatility in QLD and NSW.
(b) The lowest points are as follows
i. Sunday 3rd December down to 12,542MW at 10:00
… no articles written on the day
ii. Saturday 23rd December 2023 down to 12,122MW at 11:10 … lowest point thus far this summer
… but still no articles written on the day.
ii. Sunday 31st December 2023 was a remarkable day of new lowest-ever points in VIC and SA:
… the NEM-wide ‘Market Demand’ reaching down to 13,290MW at 12:55
… but note that this was not the lowest point NEM-wide this summer.
2) So only two days where the NEM-wide ‘Market Demand’ reached past 30,000MW
… which still jumps out at me (despite writing how many articles about ‘declining demand’ and the rise of the rooftop PV juggernaut), considering this would have been commonplace in years gone by.
Let’s see what unfolds for the remainder of summer 2023-24!


Leave a comment