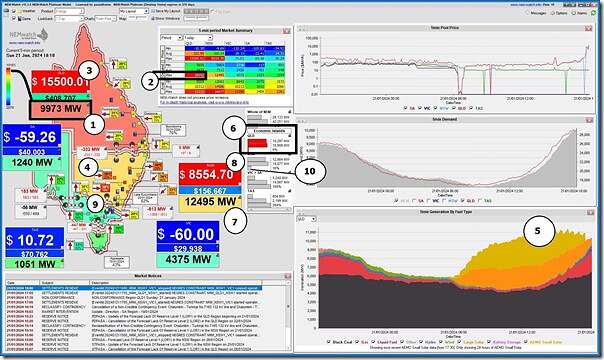
Perhaps as a taste for what might come tomorrow evening (Monday 21st January 2024), here’s a snapshot of NEMwatch at 18:10 (NEM time) on Sunday evening 21st January 2024:
With reference to the QLD, we see:
1) ‘Market Demand’ in QLD is at 9,973MW at this time
… well into the ‘red zone’ and up towards the ‘highest ever’ (set just last Friday)
2) Indeed we note that ‘Market Demand’ in QLD reached 10,052MW earlier today:
(a) In the 17:55 dispatch interval
(b) Which would be only 109 MW below Friday’s all-time maximum; and
(c) Was higher than any level that demand had achieved (by that measure) until 13th February 2019, as seen in yesterday’s longer-term trend.
3) Spot price in QLD is at $15,500/MWh
… it’s been up at the $16,600/MWh Market Price Cap as I type this
4) A significant factor being that the QNI (and Directlink) interconnectors are constrained
(a) Indeed, note that QNI is constrained such that it must flow south
i. which is not what an outsider would think made sense!
ii. just another example of the complexities of constraint equations
(b) Directlink is flowing north
(c) I’ve not checked the specifics of the constraints active at the moment …. food for another subsequent article.
5) The trended fuel mix for QLD shows, at a glance:
(a) The massive middle-of the day solar yield (rooftop PV and Large Solar) is fading fast as the sun sets;
(b) There’s the barest sliver of green (denoting wind) … bouncing around ~100MW
(c) Major volumes from gas-fired peaking plant, and some liquid fuel + also some supply from Large-Scale battery storage.
6) There’s also a very low (i.e. 6%) IRPM for the QLD-only ‘Economic Island’ formed as a result
(a) net ‘Market Demand’ in the QLD ‘Economic Island’ being 10,297MW (i.e. higher than the demand in the QLD region)
(b) being supplied by 10,908MW Available Generation
(c) meaning a tiny surplus of only 611MW
(d) or 6% IRPM.
… but not as low as the ~3.75% IRPM at 18:40!
But note also some activity in NSW as well:
7) ‘Market Demand’ in nSW is at 12,495MW … well out of the ‘green zone’ and trending upwards as well
8) Spot price in NSW is at $8,554.70/MWh
9) In large part because of constrained flow on the VIC1-NSW1 interconnector
(a) Indeed note that the flow is being constrained such that it must flow south
(b) Which is another example of ‘counter-priced flow’
(c) I’ve not checked the specifics of the constraints active at the moment, but …
i. it does remind of the general issues flagged by Allan ONeil when he wrote ‘What’s happening around Wagga?’ not so long ago.
ii. I suspect (without having looked) that there are some similar factors at work here
10) There’s also a relatively low (i.e. 16%) IRPM for the NSW-only ‘Economic Island’ being squeezed between constraints on interconnectors to the north, and to the south.
… has dropped further since posting this
Stay tuned for more …
PS1 … ‘Actual LOR1’ in QLD from 18:00
At 18:12 the AEMO published MN113570 as follows:
——————————————————————-
MARKET NOTICE
——————————————————————-
From : AEMO
To : NEMITWEB1
Creation Date : 21/01/2024 18:12:48
——————————————————————-
Notice ID : 113570
Notice Type ID : RESERVE NOTICE
Notice Type Description : LRC/LOR1/LOR2/LOR3
Issue Date : 21/01/2024
External Reference : Actual Lack Of Reserve Level 1 (LOR1) in the QLD region – 21/01/2024
——————————————————————-
Reason :
AEMO ELECTRICITY MARKET NOTICE
Actual Lack Of Reserve Level 1 (LOR1) in the QLD region – 21/01/2024
An Actual LOR1 condition has been declared under clause 4.8.4(b) of the National Electricity Rules for the QLD region from 1800 hrs.
The Actual LOR1 condition is forecast to exist until 1930 hrs
The capacity reserve requirement is 1238 MW
The minimum capacity reserve available is 988 MW
Manager NEM Real Time Operations
——————————————————————-
END OF REPORT
——————————————————————-
PS2 … ‘Actual LOR1’ in NSW from 18:00
At 18:14 the AEMO published MN113572 as follows:
——————————————————————-
MARKET NOTICE
——————————————————————-
From : AEMO
To : NEMITWEB1
Creation Date : 21/01/2024 18:13:53
——————————————————————-
Notice ID : 113572
Notice Type ID : RESERVE NOTICE
Notice Type Description : LRC/LOR1/LOR2/LOR3
Issue Date : 21/01/2024
External Reference : Actual Lack Of Reserve Level 1 (LOR1) in the NSW region – 21/01/2024
——————————————————————-
Reason :
AEMO ELECTRICITY MARKET NOTICE
Actual Lack Of Reserve Level 1 (LOR1) in the NSW region – 21/01/2024
An Actual LOR1 condition has been declared under clause 4.8.4(b) of the National Electricity Rules for the NSW region from 1800 hrs.
The Actual LOR1 condition is not forecast in Pre Dispatch
The capacity reserve requirement is 1360 MW
The minimum capacity reserve available is 1354 MW
Manager NEM Real Time Operations
——————————————————————-
END OF REPORT
——————————————————————-
PS3 … a long run of volatility
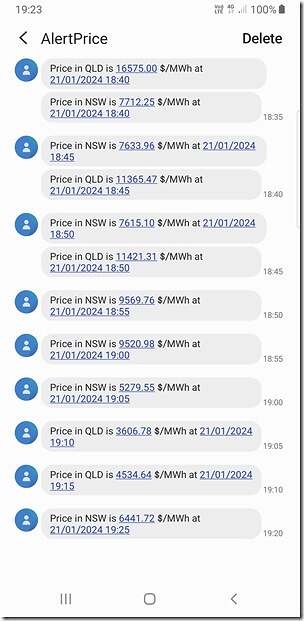
A quick snapshot of a sample of the price alerts received via our SMS alerts (triggered in ez2view) showing a long run of price volatility in QLD and NSW:


One little correction Paul – the high price in NSW wasn’t *because* of the forced southward flow on VNI. It was the outcome of a complex constraint situation that was both forcing flows out of Queensland into NSW and setting high prices in those two states, with a further side effect of the same constraints being the flow out of NSW into Victoria.