
Following the Generator Report Card 2018, the combined team (Global Roam and Greenview Strategic Consulting) have released annual updates of the Generator Statistical Digest (GSD). Now in its 4th edition the 2022 version has no less than 850 pages of analysis covering 398 operating units with up to 10 years of data.
As a welcome bonus there is an accompanying summary spreadsheet containing extracts of the data (the ‘GSD2022 Data Extract’).
In general, the GSD is not for beginners in the Australian electricity sector. Nor is it a resource from which conclusions about industry trends and directions can be instantly seen. Instead, it’s a reference for the industry specialist or at least those people that like to be able to look up the performance of a generating unit on a large range of metrics and have all the data in the one place.
We can forecast, with some confidence (because State Government polices mostly with bipartisan support have been set), that over the next decade the profound change in the generation fuel mix that has already seen the combined share of wind and solar reaching towards 30% of NEM total demand during Summer of 2022 will accelerate significantly. ITK’’s own forecast has the share getting up over 70% by 2030.
- An important part of that total supply will be behind the meter, coming from millions of individual units. Much remains to be understood about how behind the meter will fit in, and how it will be reported and analysed (including in future editions of the Generator Statistical Digest).
- In general the size of new operational units will be smaller than the size of the units they replace, and the metrics of interest may evolve. The GSD is likely to get bigger rather than smaller.
My particular focus over the past year and into next year is Queensland, the State which has the largest renewable resource, and now a policy to employ it to its maximum extent.
Annual Mix of Generation
Nevertheless, I started this review by looking at all DUIDs that contributed more than 0.5% individually to NEM wide operational production.
I hand coloured the graph for fuel:
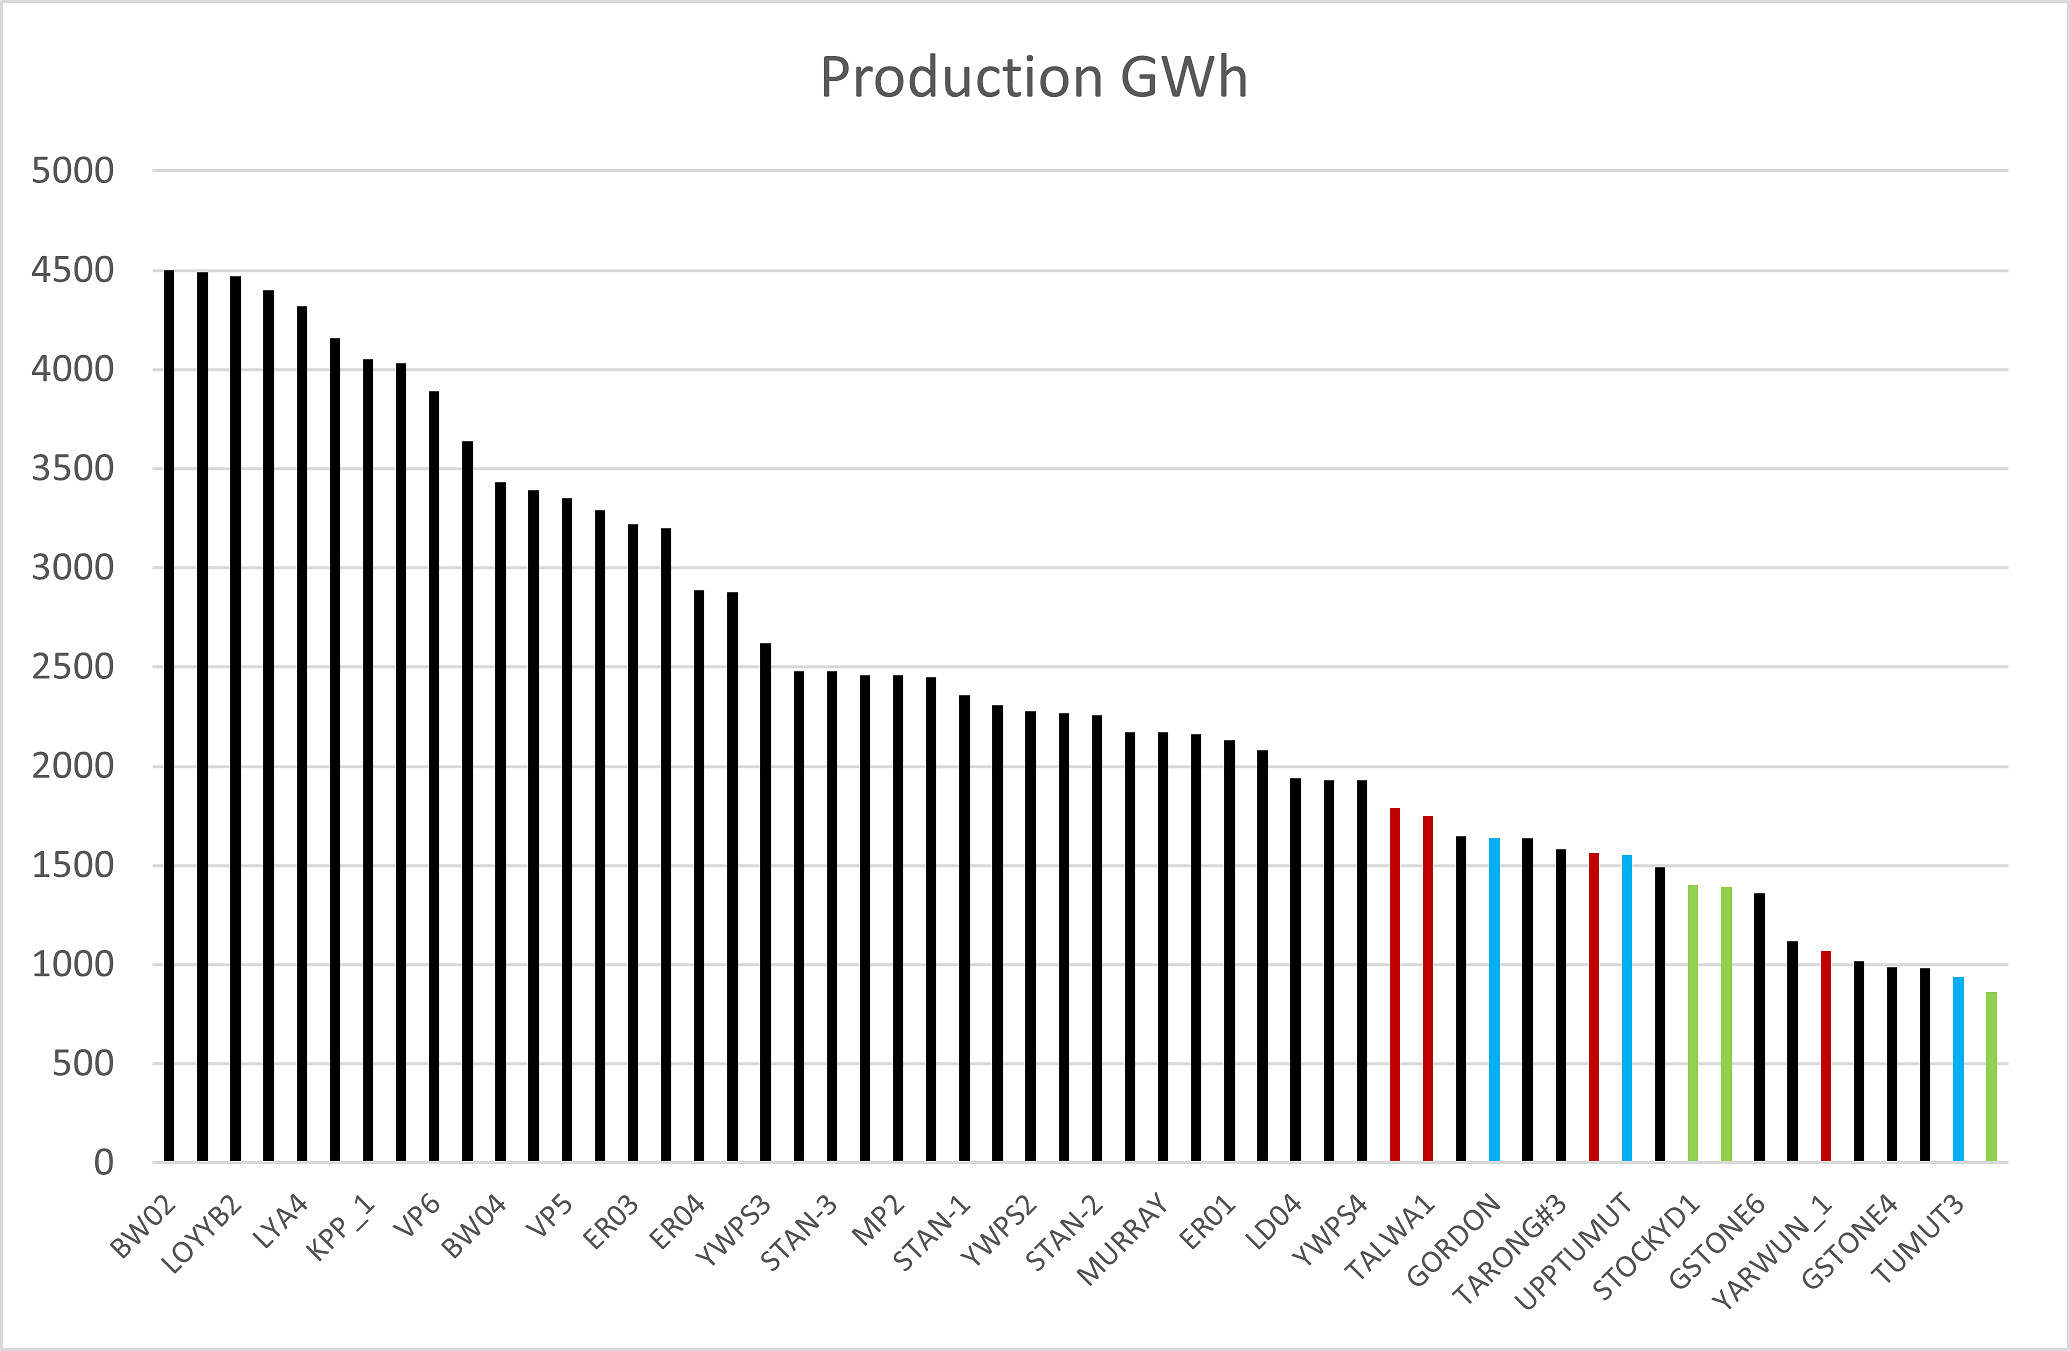
Figure 1: Units providing a total 72% of operational demand.
Source: GSD2022
There are 56 individual units of which 46 are coal. Of interest to me is that 3 individual wind farms each contributed more than 0.5%.
Many of the coal units operated for over 85% of hours although not necessarily at full capacity.
The average hours by fuel for the above units was
| 2022 operating hours/hours in year | |
| Coal | 81% |
| Gas | 71% |
| Hydro | 68% |
| Wind | 62% |
Hours subject to binding constraints
For the same units the GSD also provides the hours with binding constraints. The GSD contains a very extensive glossary. Reading through the glossary makes me realise, as a financial analyst, how much of the technical material, even after 25 years of analysis, I still have to come to grips with. The glossary states:
“Constrained Hours = Count of Dispatch Intervals (where unit CPID on left hand side of bound constraint) x 1/12 hours
Note that this metric by itself indicates the incidence of a binding constraint/s on the unit but does not necessarily indicate the curtailment impact (if any) of those constraints.. “
Nevertheless the data unsurprising showed that the hydro units were constrained with Murray having a binding constraint 40% of the time, and Tumut over 10%. Kogan Creek was constrained 15% of the time and a couple of Victorian units had constraints over 10% of total hours in the year.
Overall, the average hours a unit was constrained (total of all constrained hours/number of DUIDs with at least 1 constrained hour in a year) has increased in the past two years.
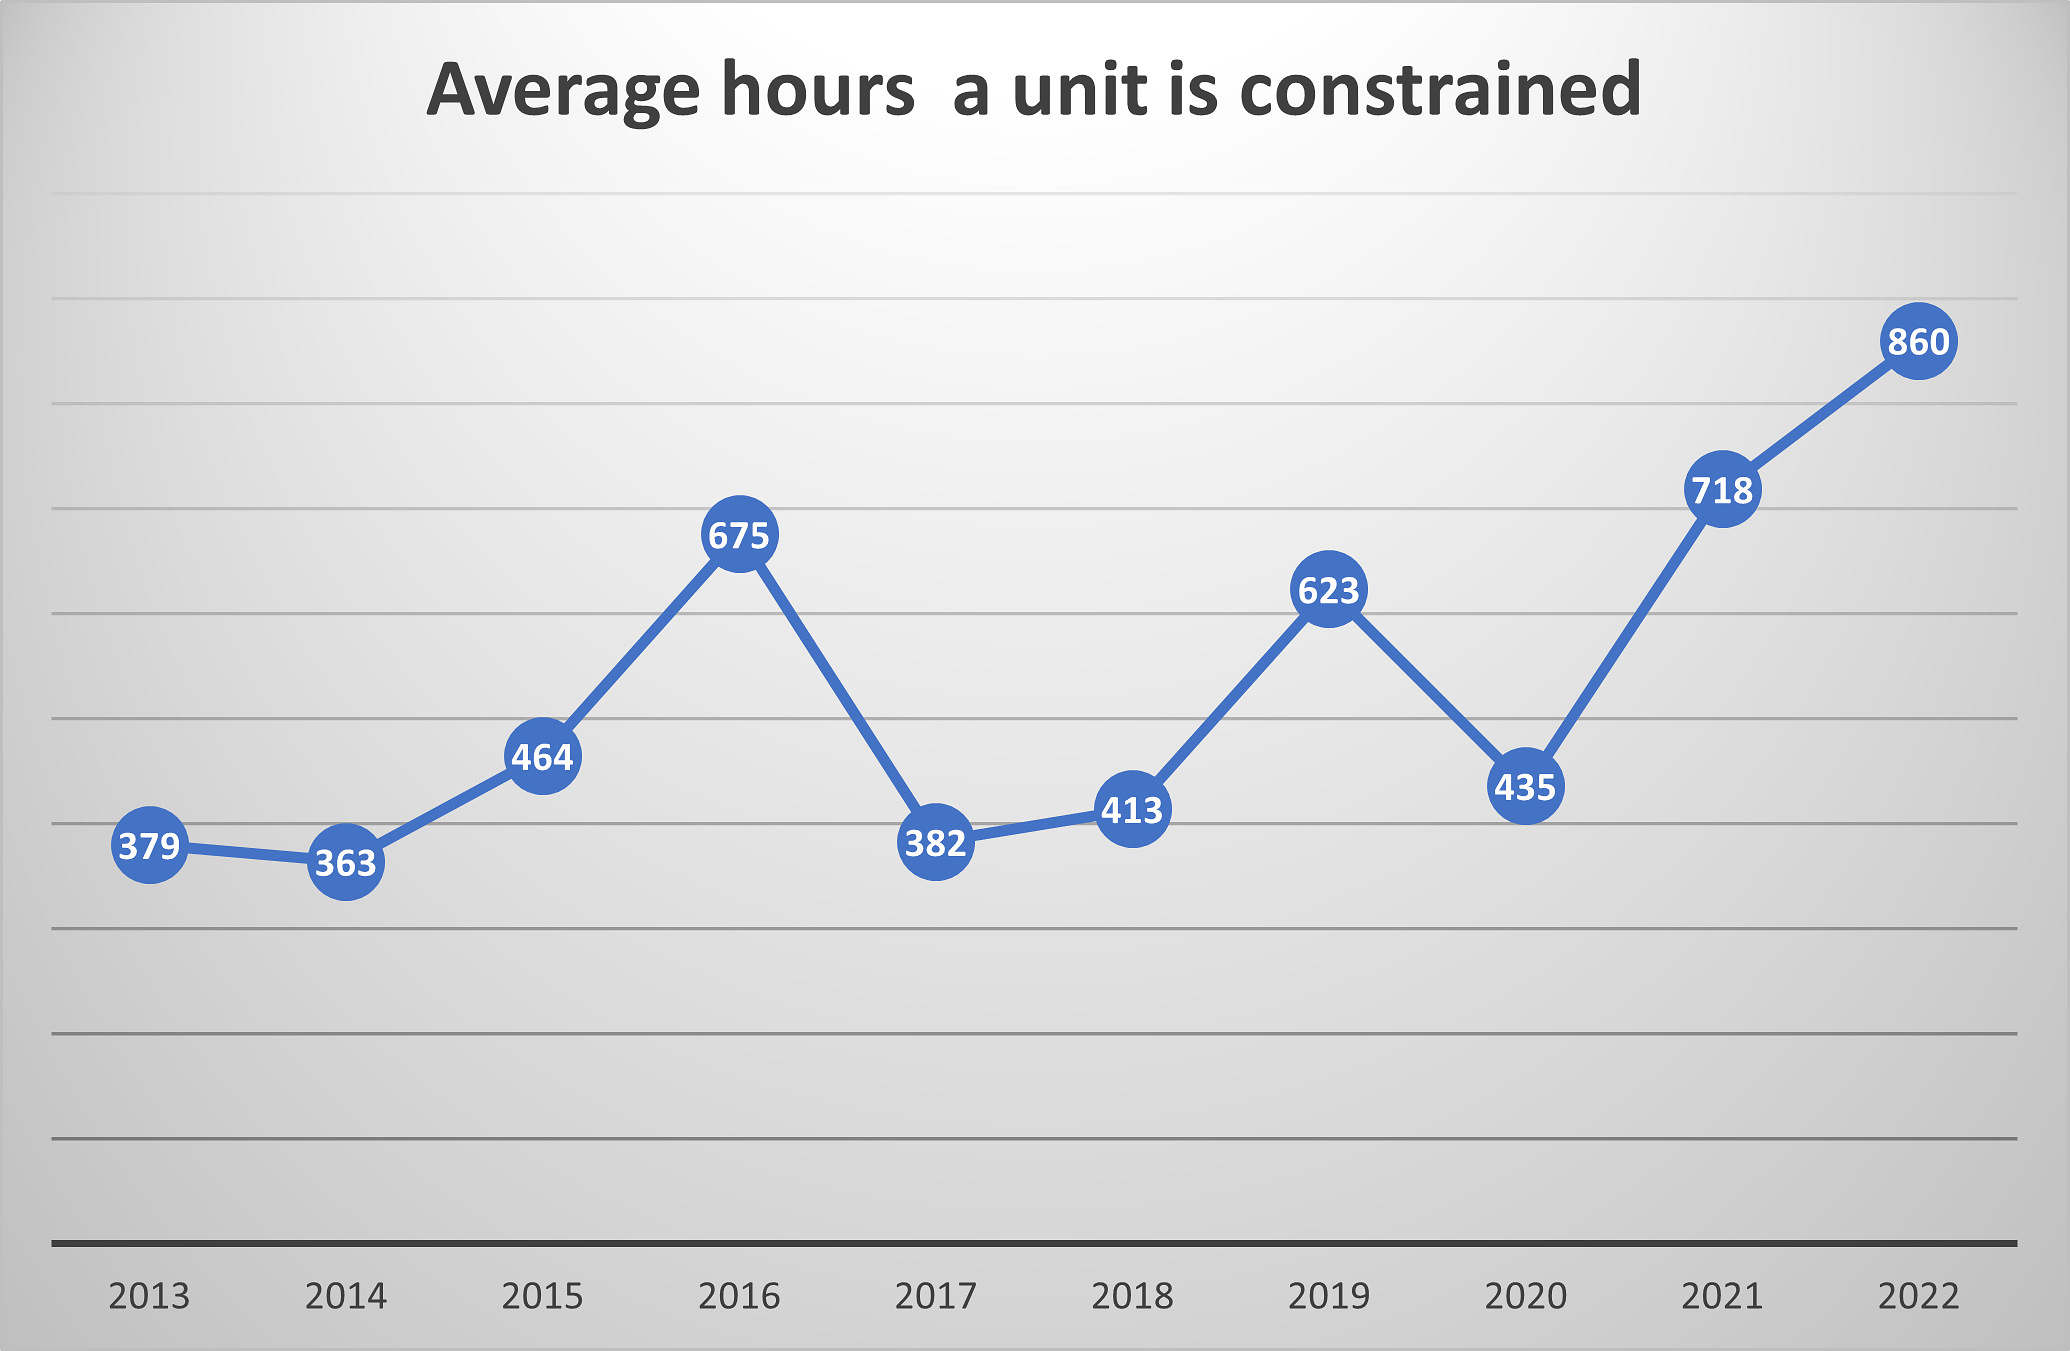
Figure 2: Average constrained hours.
Source: GSD2022
Analysis of firming
Another interesting area that will continue to receive ongoing attention is the analysis of firming power fuelled by variable renewable energy. Although a power source quite independent of wind and solar may always have a role it seems clearly desirable to use pumped hydro and batteries to reduce the variability of the underlying wind and solar supply. After all this is no different to the way in which we manage drinking water through dams.
The particular interest is again QLD because of the scale of the proposed Govt owned pumped hydro plants totalling 7,000 MW of power and over 160 GWh (24 hours) of storage. In terms of power this is equal to 3.5X Snowy 2, although only equivalent in terms of storage.
In recent years Wivenhoe pumped hydro has become more prominent in the QLD energy mix and provides perhaps a glimpse of what the future for pumped hydro holds in QLD.
Despite the large increase in the average flat load Qld price in 2022 the bid bands for Wivenhoe actually fell and operating hours increased from 398 (trivial) in 2021 to 1,689 in 2022.
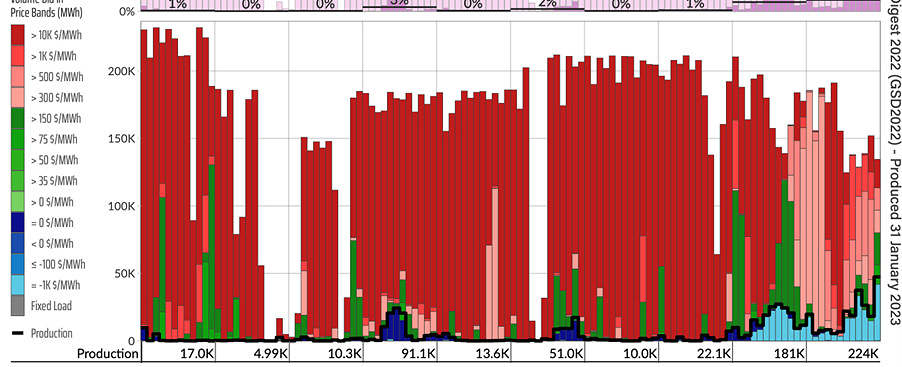
Figure 3: Wivenhoe 2 bid bands.
Source: GSD
Average price received for the year was $466/MWh compared to the RRP of $205 MWh and even in December Wivenhoe was getting $177/MWh on average. Wivenhoe’s two units combined had revenue of over $220M in 2022 which even allowing for more pumping costs will produce good profits.
————————————–
About our Guest Author
 |
David Leitch is Principal at ITK Services.
David has been a client of ours (and a fan of NEMreview) since 2007. David has been a long-time contributor of analysis over on RenewEconomy, very occasionally contributes to WattClarity! David also provided valued contribution towards our GRC2018. David has 33 years experience in investment banking research at major investment banks in Australia. He was consistently rated in top 3 for utility analysis 2006-2016. You can find David on LinkedIn here. |
Leave a comment