Last Friday evening (28th October at 17:30) we saw a price spike that was documented here at the time …
… following which we’ve started exploring a bit more (test out the new ‘Constraint Dashboard’ widget in ez2view) and will post more about later.
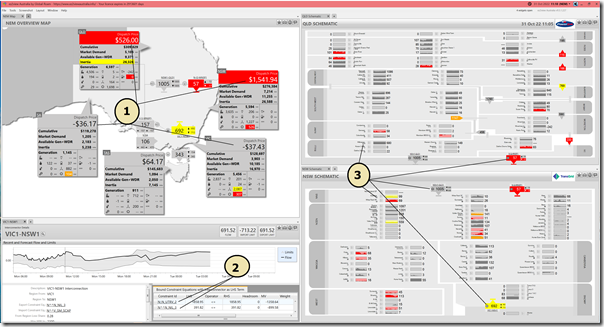
Today (Monday 31st October 2022) we saw the price spike in NSW and QLD at the 11:10 dispatch interval, as captured here in this snapshot of four widgets in ez2view on the day, Time-Travelled back to that time:
In particular, note:
1) Negative prices south of the constrained VIC-NSW interconnector (VIC and SA), and high prices to the north (NSW and QLD)
2) Those same two constraint equations bound affecting the VIC-NSW interconnector:
(a) The ‘N^^N_NIL_3’ constraint equation … otherwise known as the ‘X5 Constraint’; and
(b) The ‘N::N_UTRV_2’ constraint equation related to the ‘N-RVYS_2’ outage-related constraint set.
3) By virtue of the ‘+’ and ‘-‘ icons on many of the units in VIC and QLD, see that a sigificant number of units are subject to bound constraints (not just the two mentioned above).
More food for thought…


Leave a comment