
At the Clean Energy Council’s Large-scale Solar Forum in May 2022, I had the opportunity to present some of the initial results that our analysis was showing for Australian large-scale solar performance in the National Electricity Market (NEM).
In August, this analysis became available to the public when ARENA published Ekistica’s 5th report in the Generator Operations Series that provides a benchmark for how 26 large-scale solar farms on the NEM are performing according to the ‘performance ratio’ metric.
Over the years we’ve seen articles a number of articles published (listed in the references section below) that have commented on which Australian renewable energy generators, and therefore which states, are considered the ‘best performing’. Often these articles substitute the word ‘performance’ for ‘capacity factor’ and it’s important to understand that capacity factor is not always the most appropriate indicator of plant performance.
While capacity factor is a useful metric to understand the fraction of energy generated over a period with reference to its theoretical maximum, it does not allow one to differentiate between how plant efficiency, weather, and/or curtailment, are impacting sent-out energy. For example, a solar farm with a comparatively lower capacity factor in a given year can, in-fact, be ‘performing better’, but situated in a region that experienced more consistent rainfall events – and hence, less sunlight – than other solar farms in that year.
On the other hand, for solar farms, the performance ratio (PR) is the ratio of the electricity generated to the electricity that would have been generated if the plant consistently converted sunlight to electricity at the level expected from the DC nameplate rating. The PR calculation is a more complicated one as it uses high accuracy ground station irradiance and temperature measurements to calculate the performance of a solar farm given the observed weather conditions.
The reliance on privately-owned high-quality ground station data means that performance data for solar farms is temporally and spatially scarce, is expensive to maintain, and remains unavailable to the public. Without this data, it is impossible to compare performance between projects or benchmark the performance of solar farms operating in a particular market.
Our recent publication explores the practicability of using satellite weather data and public electricity generation data to calculate PRs for large scale solar farms across the NEM. Using satellite data, this paper introduces a solar PV performance benchmark across 26 Australian large-scale solar farms. Solar PV developers and investors can use this benchmark to broadly determine how the performance of their assets compare to others in Australia.
Owners or investors can determine whether the performance at a given solar farm is above or below average across the industry. Further, if a given solar farm’s PR is below the lower limit of the middle 50 per cent range, it is likely to be in the bottom 25 per cent of farms ranked by performance.
Performance Ratios
Three types of performance ratios are considered in the paper. These are explained in detail in the Definitions section of the report, and are briefly described below:
- Raw Performance Ratio. This indicates overall performance of the solar farm, including the impacts of curtailment. No periods are excluded from the calculation except missing data. Based on generation data and annual irradiance only.
- Unconstrained Performance Ratio. This indicates the performance of farms excluding periods of curtailment and other constraints on farm output. Based on generation data and annual irradiance only. Performance ratio guarantees provided by EPC or O&M contractors typically use some kind of unconstrained performance ratio so that periods of underperformance due to network or other factors outside the control of the contractor are excluded from the calculation that determines whether liquidated damages are payable for underperformance.
- Temperature-Corrected Performance Ratio. This is the Unconstrained Performance Ratio corrected for losses due to module cell temperature, which enables comparison of farms in different regions and better estimates of relative performance at farms with several weeks of excluded data. Based on generation, irradiance and cell temperature data.
Key Results
A summary of the key results is shown in the table below.
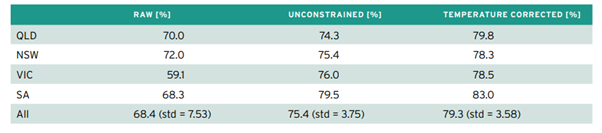
Table 1. Summary of key statistics describing performance ratio estimations for large-scale solar farms on the NEM when using satellite weather data.
While there are limitations to this analysis, as stated in the report, the results remain valuable because:
- They represent the first NEM-wide assessment of performance at large-scale solar farms, building on the limited site-based PR results from LSS sites published in Report One from ARENA’s Generator Operations Series: Large-scale Solar Operations (arena.gov.au/knowledge-bank/report-one-large-scale-solaroperations/).
- They demonstrate a robust methodology for satellite-based PR calculations that can be extended to additional farms and future years as more data becomes available.
- Although the results are from the single year 2020, the temperature-corrected performance ratio calculation results in a value that captures the underlying performance of the solar farms in question independent of the weather conditions in that year, and can thus be compared to performance ratios in future years.
References
https://www.energymagazine.com.au/australias-top-performing-solar-pv-asset-in-2021/
https://reneweconomy.com.au/australias-best-performing-wind-and-solar-farms-in-may-64699/
======================================================================================================
About our Guest Author
 |
Lachlan McLeod joined Ekistica in 2016 and provides data analysis and financial modelling for a range of projects for private investment firms and government agencies, focusing on off-grid, fringe-of-grid and utility scale grid-connected energy systems that encompass a range of technologies.
You can view Lachlan’s LinkedIn profile here. |
Be the first to comment on "Benchmarking large-scale solar PV performance"