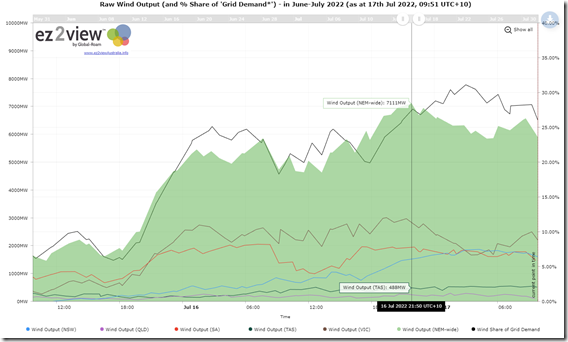
For the first time ever on Saturday evening the NEM saw more than 7,000MW of generation powered by the wind.
As shown in this snapshot (a zoomed-in view from the ez2view Trends Engine online), the aggregate ‘InitialMW’ reached 7,111MW for the 21:50 dispatch interval (i.e. so metered at 21:45):
For those with a licence to the software, you can access your copy of the live updating trend covering 31st May to the end of July here.
At this point, the share of total ‘Grid Demand’ supplied by wind was a fraction above 27% … and we can see it trended higher in the hours that followed as ‘Grid Demand’ declined through the night.
1) The reason why the trend above started on 31st May was because that’s when the previous record was set (reaching at 6,853MW metered at 16:40).
2) For more context, here’s the longer-range trend published on 4th June looking back to the start of wind generation in the NEM.


This graph is a classic example of everything that is wrong with the uncontrolled operation of intermittent generation. There is something like 500MW/hr being added at the whim of the wind from 6pm on Sat at the very time when system load will be declining. This would force other generators to ramp down and / or decommit. So please don’t complain when the reverse happens and suddenly thermal plant is expected to restart at short notice with no guarantee of recovering start up costs. How is the large gas turbine fleet needed to deal with this going to be incentivised and where is the fuel coming from? (or for that matter the deep storage. ) Forget the big Coalies – they simply won’t be able to play like this as the problem gets worse – exactly what you are seeing with older plant like Liddell & Yallourn that will simply exit.
Hello Andrew,
The whole point of the market is to get coal plants to exit currently. If the greens had gotten into power they had planned to simply start shutting them, not even have them exit.
And not in any order or age either, it seemed rather random.
I have an issue with this article.
Wind (excuse the pun) back just a few days to 14th July and during the evening peak wind production was a paltry 600MW. This is less than 10% of rated capacity, supplying a measly 2% of the NEM demand.
The fact that wind output can vary so much over the period of just a few days is a far more news worthy and important issue than reporting a once in year outlier in maximum wind generation.
Michael
There are a number of article (like the following) on WattClarity that also point out the lows:
https://wattclarity.com.au/articles/2022/05/27may-short-term-wind-lull/
It’s becoming increasingly the case that both extremes need to be recognised, and the averages become increasingly just that … average. This has also been noted a number of times here.
Paul