Interconnectors, which connect the five pricing regions of the NEM, play a key role in the price-setting process. See here for an explainer which covers the basics of price-setting and the role of interconnectors. The short summary is that interconnectors allow energy from one region to flow into another region to give a lower-cost outcome for the system overall. When this happens, both regions are priced the same (with adjustment for losses), but when an interconnector reaches its limit, that is it’s unable to transfer any more energy, prices in the two regions can diverge significantly. How can we know when an interconnector is at its limit, resulting in price separation? This article has a look at a few traps we’ve uncovered in our efforts to bring the best information to our clients.
It’s important to note that none of the identified issues in the published market data make any difference to the dispatch outcomes, but make it harder for users of the data to interpret it correctly.
Interconnector limits and price separation
Why are we interested in whether the interconnector is at limit? One big reason is because it indicates there’s likely to be price separation between regions (when ‘Economic Islands’ form), which helps explain in the short- and long-term how prices in each region are determined.
1) For example, limitations on the Heywood interconnector can make the price in SA spike high if energy can’t get in from VIC during high demand, or crash because energy can’t get out during periods of high wind generation.
2) A more contemporary example is what’s been happening with import limitations on QNI because of an outage between Armidale to Tamworth in NSW, as Paul found again this morning.
Tight limits on interconnectors are common during interconnector maintenance … such as is happening recently on QNI, and which limited VIC-NSW flows not so long ago.
Even without interconnector maintenance (i.e. with “system normal” constraint equations – limitations AEMO applies at all times), can bring about significant price separation on a routine basis. This is currently often seen between VIC and NSW on sunny days with the ‘X5 constraint’– more on that on page 30 in AEMO’s Q1 2022 Quarterly Energy Dynamics, and in a future article on WattClarity.
Knowledge of the patterns and drivers of this price separation may influence bidding strategies, outage planning, and in the longer term, investment decisions based on price forecasts.
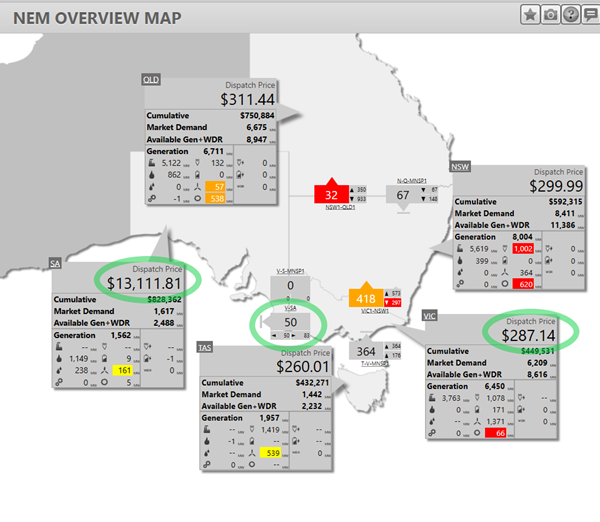
The map above is a snapshot of the NEM on 17 May 2022 at 07:50 taken from the ‘NEM Map’ widget in our ez2view software (this is incidentally the same morning Paul wrote about here).
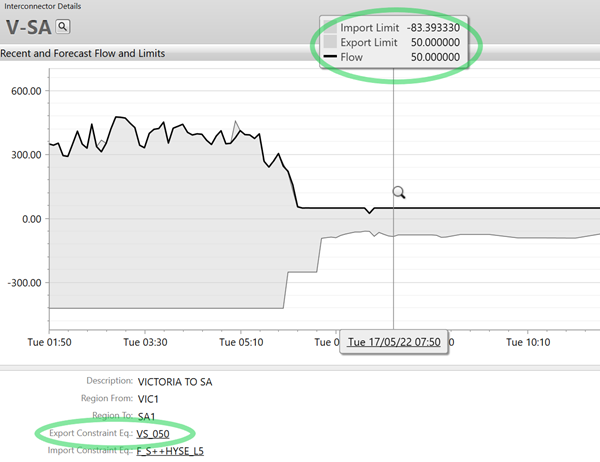
Circled in green are the SA price (an extreme $13,111.81/MWh), the VIC price ($287.14/MWh), and the V-SA interconnector, otherwise known as the Heywood interconnector, shown here with a limit at 50 MW flow into SA. In ez2view the bar across the interconnector arrow indicates the interconnector is at its limit. The large 50 is the “target” flow, the flow AEMO’s dispatch engine expects at the end of the 5-minute interval, and the little 50 below it is the export limit – the limit of the flow on the interconnector west.
A convention to be aware of here:
1) an interconnector is said to be exporting if its energy is flowing north or west, and importing if flowing south or east.
2) In NEMDE and the EMMS, exports (i.e. flow north and west) are written as positive numbers, whereas imports are written as negative numbers. In our ez2view software we strip the +- sign off the number when we show it with an arrow.
How to determine if an interconnector is at limit or bound?
So how did we decide in the ez2view software that the interconnector was at its limit? This is where is starts to get complicated. What we’ve done in the software is what I’ll call the “robust” way – we compare the value of the interconnector target to the value of the published export and import limits. There are often slight numerical differences in these values getting into the decimal places, so we do a bit of rounding before deciding if they’re the same or not. At times this might give a “false positive”.
The more mathematically-inclined, who don’t like the idea of inexact numerical comparisons, think about whether the interconnector is “bound”, that is whether there’s a binding constraint equation with the interconnector on the left-hand side. A binding constraint equation is one that has a non-zero marginal value. For a detailed background on constraints see this excellent explainer by Allan O’Neil. Key point for here: a “bound” constraint equation is one that’s having an effect on the dispatch solution, as evidenced by a non-zero marginal value, which is the value that shows how the cost of the total dispatch solution would change if there was a small change in the RHS of the constraint equation. An interconnector might look like it’s at its limit if the target and limits are numerically close, but if it’s not being limited by a bound constraint equation, the limit won’t be causing price separation.
Three traps!
It sounds straightforward enough, if you have knowledge of AEMO’s EMMS database, but we’ve uncovered three traps that may lead users of the data to miss intervals where the interconnector is bound.
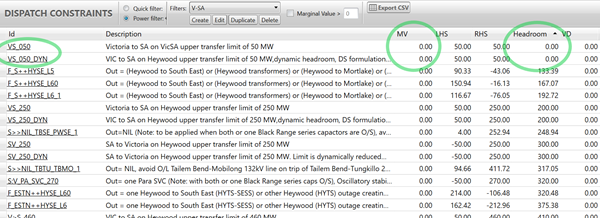
Let’s start with a first-cut of a “precise” process to determine if an interconnector is bound. AEMO publishes for each interconnector in each dispatch interval an export and an import constraint equation, as shown in ez2view below. We’ll test if the export constraint equation is bound (has a non-zero marginal value) in the interval pictured (17/5/22 @ 07:50).
Trap 1: Interconnector constraint equations with zero marginal value
Here are the details of the constraints with V-SA on the left hand side in this interval, sorted by headroom (which is our calculation of the RHS of the constraint equation minus the LHS).
Here’s trap 1: In this particular interval, AEMO’s published export constraint equation, VS_050, has a marginal value (MV) of zero, despite the export limit of 50 to 6 decimal places matching the target flow, and the $13,000 price difference we observed. On closer inspection, it turns out there are two constraint equations VS_050 and VS_050_DYN that in this interval both appear to limit the interconnector export to 50 MW. But VS_050_DYN also has a zero marginal value in this interval! Given such a large price separation it’s unlikely the dispatch solution picked 50 MW for the target flow without those constraint equations having an impact. Our test looking at the marginal value of the limit constraint equation tells us that the interconnector isn’t limited by a bound constraint equation, which is pretty confusing for our purpose of identifying the cause of the price separation.
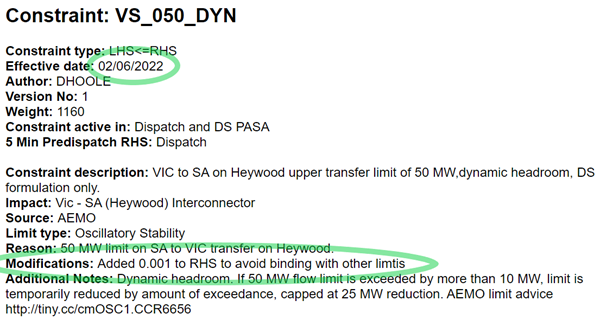
Following our recent enquiry, AEMO implemented a fix to this pair of constraint equations (see below), and to other similar pairs of constraint equations. The fix was to make the RHS very slightly different so that VS_050 will bind just before VS_050_DYN, and so show a non-zero marginal value and appear bound. These constraint equations haven’t been invoked since this change so we can’t check how it’s working, but they will be in the next few weeks. In the meantime, here’s a warning – if you’re looking at interconnector limits by checking for bound constraint equations, especially on V-SA, before 2/6/22 you might be missing some. A slightly less-precise alternative would be to look at the constraint headroom instead – which is perhaps what would need to be done to pull out the historical instances of VS_050 and others.
Trap 2: There may be more than one constraint equation that could set the limit
Here’s trap 2: Assuming there is a bound constraint equation, how do we know which one to check? It turns out that it’s not reliable to use AEMO’s published export or import constraint equation as the only constraint to check. These export and import limits are calculated in a post-processing step after the dispatch solution has been calculated, as the linear-program optimisation that solves the dispatch gives one solution only, not a set of what-ifs. For each constraint equation with the interconnector on its left-hand side, the limit is calculated based on how far the interconnector flow could move (assuming all other things remained equal) before the constraint bound. This is just an estimate of where the constraint equation might bind. For simple constraint equations, such as VS_050 above, it’s just +1.0000 * V-SA <= 50, so it’s pretty clear the limit will be 50 MW. For more complex constraints there could be many dispatchable units and other interconnectors involved, so it’s unlikely that in slightly different market conditions the only thing that would change would be the interconnector flow. Still, it’s the best we have.
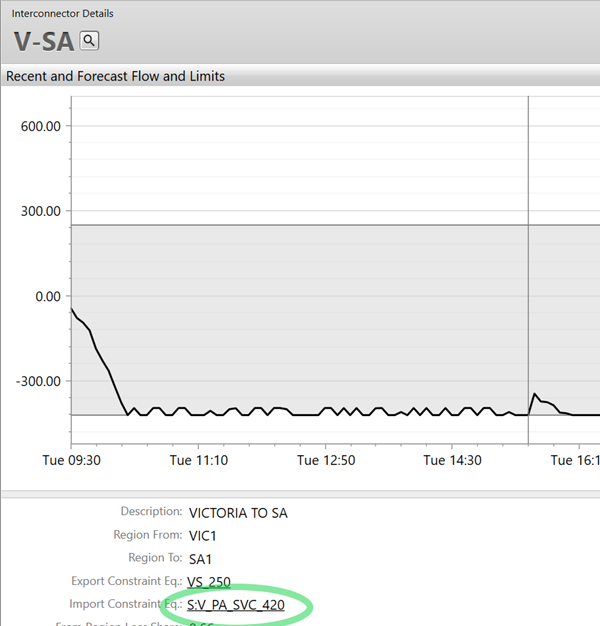
The screenshot above is from 31 May 2022 @ 15:30, showing two constraint equations involving the V-SA interconnector with zero headroom – S:V_PA_SVC_420 (with zero marginal value), and SV_420_DYN (with a non-zero marginal value, so binding). Which one does AEMO show as the export limit constraint equation?
Looking at the list of dispatch constraints above, this is the equation with a zero marginal value! So if you checked whether the interconnector was at limit by just using this constraint, you’d conclude it wasn’t. It’s often the case that there are two or more constraint equations involving the interconnector that are bound, or that have the same effective limit. AEMO needs to show only one in the database table as the limit equation, so takes the first in alphabetical order. Don’t read any more into the choice of limit equation than that.
The original “precise” strategy for seeing when an interconnector’s at limit is looking a bit tatty at this point. We can’t just look at the constraint equation listed as the limit equation to see if it’s bound – we need to look at all (which is a much more complex query). In addition, we may be better off making a numerical comparison of the headroom of the constraints (comparing RHS to LHS) than looking if a constraint is technically binding with a zero marginal value, given trap 1 above. Maybe there’s an easier way?
Trap 3: Published flags on binding interconnector constraints don’t include FCAS
Here trap 3: The interconnector dispatch information table in AEMO’s EMMS (market database), along with most of the interconnector-specific information we show in ez2view, has fields named LOCALLY_CONSTRAINED_EXPORT and LOCALLY_CONSTRAINED_IMPORT. Bingo! That sounds like just what we need. The values change from zero to 1 or 2 depending on the type of constraint (outage or system normal) when there’s a binding constraint on the interconnector.
This is unfortunately not the whole story – as these values stay at zero when the limit is caused by FCAS constraints.
For example, on 22 March 2022 @ 06:15, the NSW1-QLD1 (QNI) interconnector had its export limit set by a binding FCAS constraint F_Q++LDTW_R6. There is price separation, but the LOCALLY_CONSTRAINED_EXPORT and LOCALLY_CONSTRAINED_IMPORT fields are zero. These fields also don’t get around Trap 1, as in the case above of VS_050 on 17/5/22 @ 07:50, the LOCALLY_CONSTRAINED_EXPORT is zero. So these fields by themselves aren’t a complete solution.
Improvements to interconnector information in ez2view
Here at Global-Roam we’re working to improve the information about interconnectors that is displayed in ez2view.
1) We’ve already included some snapshots of a new ‘Constraint Dashboard’ widget that will be useful with respect to all terms on the LHS (including interconnectors);
2) In addition, we’re also working on an ‘Interconnector Dashboard’ widget, which will make it easy to explore interconnector limits and targets across a period of time and to assess which constraint equations are limiting the interconnector and how often. We’re aiming to make it easy to see patterns, for example that some constraint equations have more effect on interconnector flows in the daytime, while others more at night. We’re still working through whether the “robust” or some variation on the “precise” strategy discussed here is most informative in indicating when an interconnector is limited or bound.
One feature we’ve been asked for by several clients is to show the “next” constraint limit behind the current limit. As explained above, the “limit” when the constraint isn’t binding is just an estimate of where the dispatch solution might land in different circumstances. We can use the constraint equation headroom and the factor on the interconnector in the constraint equation to estimate and then rank the “next” limits. This will allow clients to see (roughly!) how the interconnector limits might change if a particular constraint was out of the way – for example if an outage was cancelled, or a constraint equation was reformulated.



Hi folks,
I’ve got a much more basic question – how are interconnector import and export limits calculated by AEMO? How much relates to interconnector physical limits / design and how much relates to NEM demand / supply?
And why are the import and export limits often different to each other? For example, on the VIC-NSW interconnector right now, the export limit (VIC–>NSW) is 183 MW and the import limit (NSW–>VIC) is 18 MW.
Never did get a response to your question Andrew?