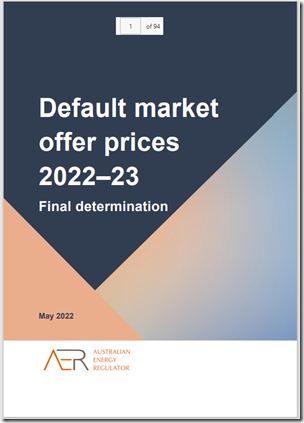
Today (Thursday 26th May) the AER has published their Default Market Offer (DMO) for the 2022-23 financial year…. two days after (and for similar reasons) the ESCV did the similar thing with respect to the Default Offer for Victorian electricity consumers.
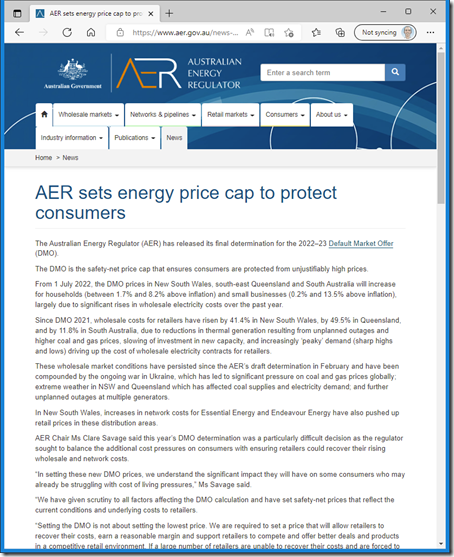
The AER notes on this page on the AER website on that page:
‘From 1 July 2022, the DMO prices in New South Wales, south-east Queensland and South Australia will increase for households (between 1.7% and 8.2% above inflation) and small businesses (0.2% and 13.5% above inflation), largely due to significant rises in wholesale electricity costs over the past year.
Since DMO 2021, wholesale costs for retailers have risen by 41.4% in New South Wales, by 49.5% in Queensland, and by 11.8% in South Australia, due to reductions in thermal generation resulting from unplanned outages and higher coal and gas prices, slowing of investment in new capacity, and increasingly ‘peaky’ demand (sharp highs and lows) driving up the cost of wholesale electricity contracts for retailers.’
The webpage links to this PDF document:
(A) Four factors flagged for wholesale price increases
Worth highlighting, for those who skim quickly, that the AER has flagged four discrete factors for increased wholesale costs:
Factor 1 = thermal generation outages … particularly unplanned
There have been a number of articles written about this here on WattClarity previously.
Will come back and link some in here later…
Factor 2 = higher input fuel costs … for coal and gas
There have been a number of articles written about this here on WattClarity previously.
Will come back and link some in here later…
Factor 3 = slowdown of investment in new capacity (not often flagged!)
Whilst on WattClarity (and in GenInsights21 and so on ) we’ve discussed the challenges facing new entrants in the Semi-Scheduled (wind and solar) and Scheduled (battery and thermal peaking) spaces, we’ve not written too much about the implications of slower investment roll-out.
So have made a mental note to cover this more in future…
Factor 4 = increasingly ‘peaky’ demand shape (not often flagged!)
This is something we have discussed previously on WattClarity, but in particular also covered in GenInsights21.
See, for instance, this video of presentation about GenInsights21 to Smart Energy Council and consideration of Appendix 15 and its implications (from the ~ 0:26:36 minute mark).
Other Factors
There are almost always multiple factors contributing to any particular outcome. The AER lists 4 on their summary web page, but there are others as well.
As just one example – in other locations (like WattClarity) it’s been noted that transmission congestion (particularly impacting on interconnectors) has also been a significant factor.
Something to keep in mind with respect to the never-ending discussion about what’s to ‘blame’…
(B) Further information
For further information, see the AER webpage:
… and this PDF document.


Leave a comment