The electricity and gas market’s thrown up a few ‘interesting’ events today – including a run of volatility that’s been growing into Monday evening (30th May 2022).
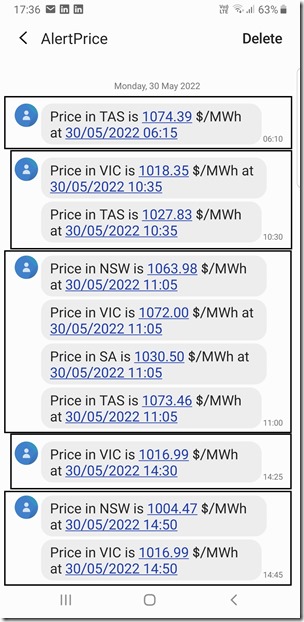
Here’s a snapshot of some of the earlier pricing excursions above $1,000/MWh (via SMS alerts form our software) highlighting that the volatility kicked off at 06:15 this morning in Tasmania, with other excursions through the morning in the southern regions and into the early afternoon.
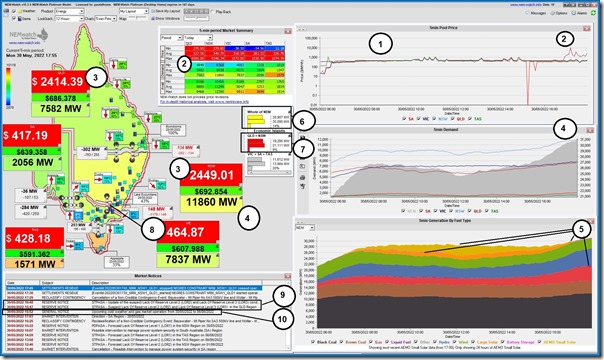
However this evening it’s really kicked off in earnest, with QLD and NSW most prolific in the excursions. Here’s a snapshot of the 17:55 dispatch interval via NEMwatch v10 showing a number of different things:
With respect to the numbering in the image:
1) The earlier spikes in the southern regions were to ‘only’ just above $1,000/MWh
2) The significance of these prices is obscured somewhat by the higher spike in QLD and NSW above $9,000/MWh in the 17:10 dispatch interval
3) The run of volatility for QLD and NSW began at 16:50 and in the 17:55 dispatch interval in the snapshot we see the prices above $2,000/MWh in both regions … and the other three regions well above the $300/MWh ASX cap trigger price.
4) We see the pronounced ramp up in evening ‘Market Demand’:
(a) Fundamentally due to the earlier sunset (earlier onset of lighting, and earlier end to rooftop PV) and cooler temperatures.
(b) In absolute terms it’s the largest region but also in relative terms we see the NSW region up in the ‘yellow zone’ on a historical range.
5) In the fuel mix trend there are many observations that can be quickly seen, including:
(a) As noted above, solar has gone to bed
(b) However it also surprised me how low the aggregate harvest in the middle of the day was … it was a bleak day in Brisbane and I wonder how widespread those solar suppressing conditions were spread?
(c) perhaps supported by the pricing volatility through the day, we can see smidgeons of pink colour for battery charge through various portions of the day … and of course this evening as well.
(d) Liquid-fuelled peaking generation is running, as we would expect
(e) And the wind generation is back and blowing consistently.
…. which makes me wonder more what’s not supplying, in aggregate? (food for another article)
6) On a NEM-wide basis at this point we see that the IRPM (Instantaneous Reserve Plant Margin) has triggered a yellow level alert by dropping below 15% at this time:
(a) This does not happen all that frequently
(b) At this time we have 4,188MW of spare capacity above aggregate ‘Market Demand’ of 30,907MW across all the regions
(c) Which calculates as 13.55% … rounded up to 14% in the display.
7) The QLD+NSW ‘Economic Island’ is seen to be tighter in that local area:
(a) Spare capacity of 1,816MW across the two regions – above the 19,295MW net ‘Market Demand’ supplied across both regions allowing for the 148MW import from VIC
(b) Which calculates at a 9.4% IRPM … i.e. a ‘red level’ alert because it does not drop that low all that often.
8) This is happening because the VIC-NSW interconnector is constrained flowing north to only supplying a small fraction of what would be possible with the thermal limit on the lines.
(a) Not shown here, but accessible in ez2view … for this particular dispatch interval, the export limit on the interconnector’s been set by the ‘CA_SYDS_51A7040E_1’ Constraint Equation … which AEMO describes as
‘Constraint Automation, O/L 61:LN61:Z:330@CROOKWF@NSW for CTG LNQT on trip of COLLECWF-MARULAN 4 330KV LINE. Generated by STNET[NORCR1] Host NORREGEEMP4(EMPSYD)’
(b) But there are a few different constraint equations playing a role in limiting flow north (order of significance varying by time).
9) Also highlighted is the earlier scare caused by AEMO’s Market Notice about forecast LOR3 in QLD … until they realised the data input error!
10) Finally I’ve highlighted the other Market Notice about cold weather and a request to gas-fired generators.
‘Interesting’ times indeed…


Leave a comment