The ‘messy collapse of coal’ has been in the news a huge amount in recent weeks … and it’s also what we featured as Key Observation #11 within Part 2 of our GenInsights21 release recently.
With respect to GenInsights21:
1) If time permits over the next week or two, we will endeavour to publish a ‘Reader’s Guide for GenInsights21 – implications about this messy collapse of coal’ with the objective being:
(a) To provide some tips to the growing number of clients to help them best utilise their copy of GenInsights21 to understand some implications of this change; and
(b) It should also be useful to the broader readership on WattClarity.
2) Speaking specifically to those who have ordered their own copy of GenInsights21 … based on your feedback (thanks!) we have expanded the number of bookmarks within the PDF copy. You can now download your own updated version of GenInsights21 (i.e. now v3) here today.
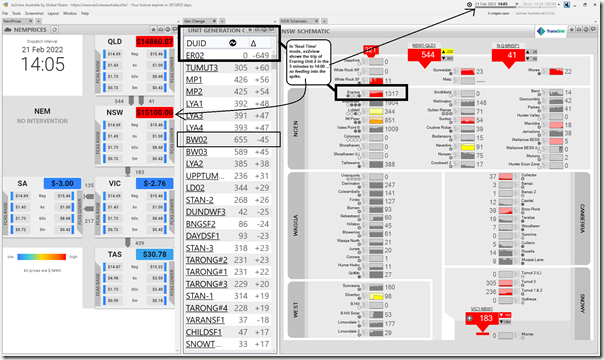
Quite coincidentally, early this afternoon we saw a simple reminder of the challenges we’re going to grapple with as this transition picks up pace, with the price spiking to the $15,100/MWh in the NSW region for the 14:05 dispatch interval following a trip (from near full load) at Eraring Unit 2 on Monday 21st February 2022:
A couple quick notes:
(A) Change in DUID output
The ‘Gen Change’ widget in ez2view lists change in output for all DUIDs … ranked in descending order of size of change:
1) In ‘Real-Time’ mode it shows InitialMW (i.e. start of interval SCADA values):
(a) That’s all that is visible in real time;
(b) This is what’s shown in the image above … so it’s showing change from 13:55 (metered time) to 14:00 (metered time).
(c) Hence this image provides a clear view of what seems the most significant factor contributing to the spike in NSW … and also QLD.
2) Remember that flipping to ‘Time-Travel’ mode shifts this widget (and the Schematic widgets as well, along with some others) to utilise ‘Final MW’ instead as end-of-interval values.
The ‘Gen Change’ widget (under ER02) shows all the units that ramped up over the same period to make up for the shortfall caused by the loss of 649MW at ER02 … i.e. mostly the Tumut units and also contributions from many coal units. It’s notable that Bayswater unit 2 also dropped output by 45MW for reasons that are not clear at this point.
(B) Other factors
Note that the trip of Eraring was not the only factor present today … for instance the ‘+’ symbols on many generation units in NSW shows the impact of several constraint equations that are bound and:
1) Limiting output of some units (particularly the more remote wind an solar); but also
2) Restricting the VIC1-NSW1 interconnector from transmitting any export from VIC to NSW – specifically in this case, there are two involved:
(a) The infamous ‘X5 constraint’ (i.e. formal name ‘N^^N_NIL_3’) which Allan described here previously, and which has been significant enough that it’s been singled out for special mention in AEMO’s QED for Q4 2021 (see p32/65).
(b) Also the ‘N::N_LTYS_2’ constraint equation, which is one of a number in the ‘N-LTYS_03’ constraint set, and related to an outage on the Lower Tumut to Yass 330kV line.
Nothing further, at this time…


Leave a comment