
This article was originally posted on WeatherZone, with some maps and data provided by Solcast.
A wet, mild and cloudy November in Australia
Last month was Australia’s wettest November on record and its coolest November in 22 years. It was also an exceptionally cloudy month for many parts of the country.
Australia’s eastern capital cities had their cloudiest November in 40-45 years. In Sydney, there was only 4.9 sunshine hours on average per day (cloudiest Nov in at least 45 years), while Brisbane only saw 6.4 hours of sunshine per day (cloudiest Nov in 40 years). This was around three hours less sunshine per day than usual for November in both cities.
Some southern capitals were also plagued by cloud last month, with Melbourne experiencing its cloudiest November in more than 20 years (average of 6.5 hours per day).
Adelaide fared a little better, with 8.5 hours of sunshine per day, making it the city’s cloudiest November in only four years.
The video below shows how widespread cloud cover was across Australia during the passage of a thick northwest cloud band towards the end of the month. This was one of several cloud and rain-bearing weather systems that swept over Australia in November.
Video: Enhanced water vapour satellite imagery showing a northwest cloud band crossing Australia on November 23/24.
Solar generation impacted by cloud cover
November’s prolific cloud cover reduced solar generation in several states.
The maps below from Weatherzone’s partner, Solcast, show how thick cloud cover reduced solar irradiance on November 11 and November 24.
Vidoes: Total global horizontal irradiance on November 11 (top) and November 24 (bottom). Source: Solcast
Data from OpenNEM reveals that November’s cloudiness caused the first drop in year-on-year solar output since 2017 for NSW and QLD. There was also a noticeable impact on solar output in SA and VIC last month.
The graphs below show the total November solar generation (rooftop and utility combined) for QLD, NSW and VIC.
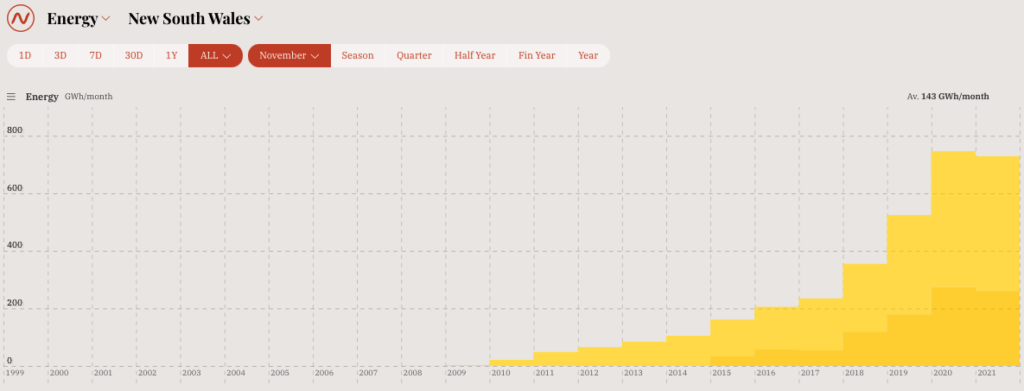
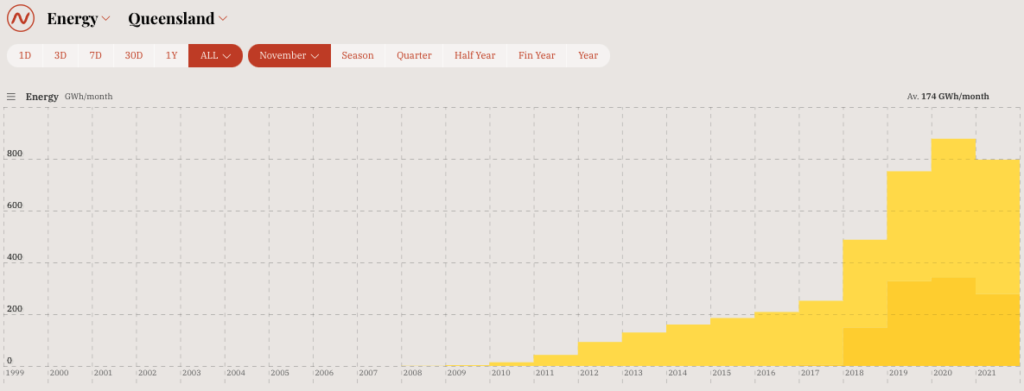
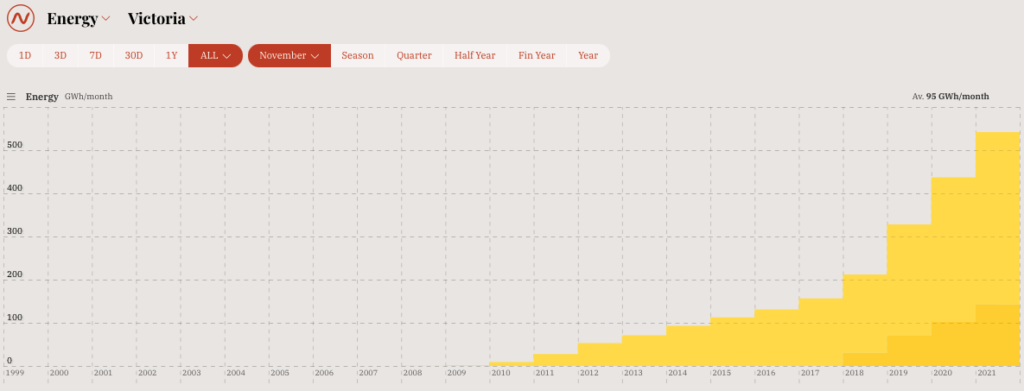
Images: Total November solar generation (rooftop and utility combined) for NSW, QLD and VIC. Source: OpenNEM.
These graphs show that total November solar generation had been increasing year-on-year during November for the past decade, driven by a boom in solar installations across Australia.
However, November 2021 saw a noticeable drop in solar generation, even as solar installations continued to climb.
The Australian Clean Energy Council reported that small scale rooftop solar had increased to 7 percent of Australia’s total annual electricity generation in November 2021, up from 5.5 percent the previous year.
The fact that solar generation saw a year-on-year drop during November 2021, despite the continued growth in solar installations, highlights how much of an impact cloud cover had on the performance of solar power in the National Electricity Market (NEM), particularly for Australia’s eastern states.
It’s worth pointing out that while overall solar generation was hindered by cloud cover during the month, there were days where it made up a large contribution of total generation.
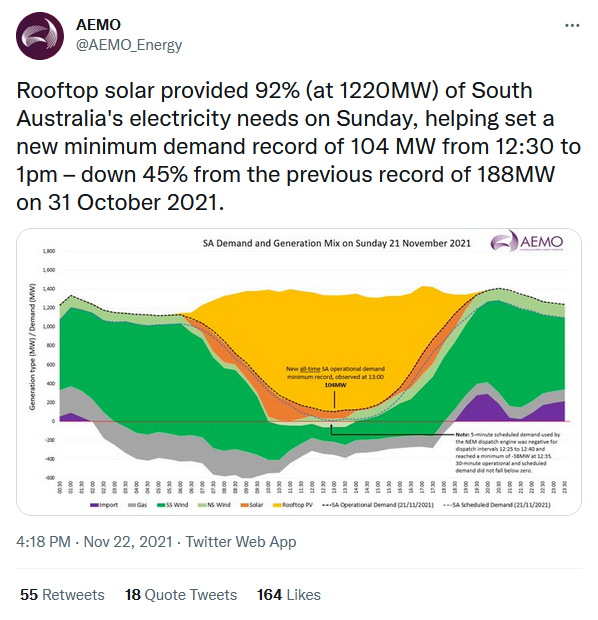
A combination of mild weather and sunny skies saw both SA and VIC set new minimum operational demand records towards the end of November. On these days, the rooftop solar contribution was 49 percent and 92 percent of the total generation in VIC and SA, respectively.
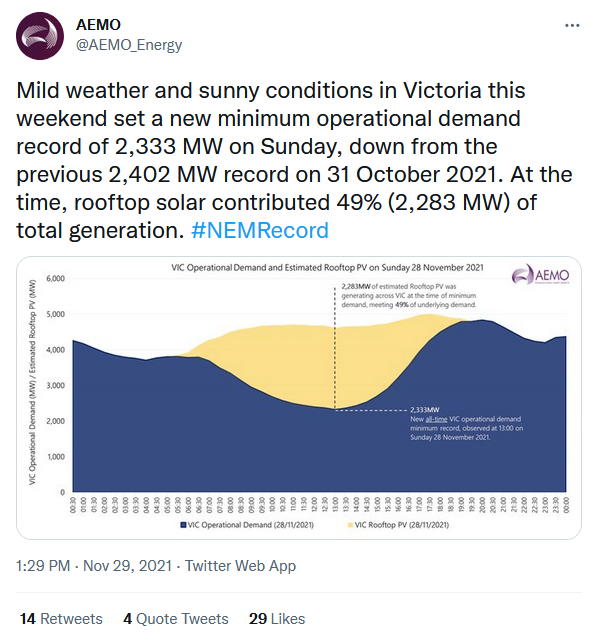
Source: AEMO Twitter
Why was it so cloudy and wet?
Australia’s wet, cool and cloudy November was caused by a combination of several climate drivers all causing elevated levels of moisture-laden air to flow towards the continent.
- La Niña became firmly established in the Pacific Ocean during November
- An active pulse of the Madden Julian Oscillation (MJO) moved into the Australian region
- A negative Indian Ocean Dipole (IOD) pattern lingered in the Indian Ocean
- A positive Southern Annular Mode (SAM) persisted to the south of Australia
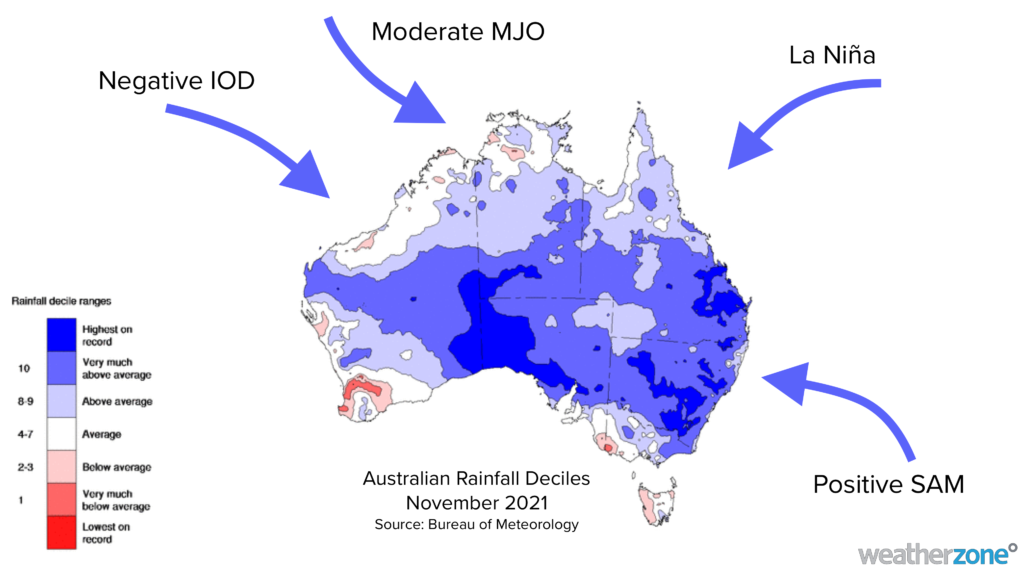
Image: Australia’s wettest November on record was caused by the combined effort of several climate drivers.
With La Niña and a positive SAM forecast to persist in the coming weeks and months, above-average rain and cloud cover are likely to remain a feature for eastern Australia this summer.
November showed how much the weather and climate can influence the performance of solar power in Australia. Weatherzone and Solcast are creating industry-leading foecasts, on a range of timescales, to help the solar industry know what’s on the horizon and continue it’s strong growth.
Editor’s Note: Ben’s article this afternoon was particularly relevant to us as we have our heads down finalising GenInsights21, which contains deep dives into Rooftop PV (Appendix 13) and Declining Minimum Demand (Appendix 14). Paul published a longer note about our progress on Monday, and we are now expecting to have the full report released next week.
======================================================================================================
About our Guest Author
 |
Ben Domensino is a Communications Meteorologist at Weatherzone.
Weatherzone, a DTN company, is Australia’s largest private weather service and was established in 1998. Their team of highly qualified meteorologists understands the effect the weather has on the day to day operations of businesses of all kinds. They also run Australia’s most popular consumer weather website and mobile app. Weatherzone provides market-leading weather insights to more than five million Australians and over 15 industries, including energy, mining, agriculture, ports, aviation, retail, insurance, broadcast media and digital media. You can find Weatherzone and Ben Domensino on LinkedIn. |
Leave a comment