On Wednesday I posted this initial review of our high-speed frequency reading from postcode 4064 in Brisbane. In this article we will briefly update and extend as follows:
(A) There were actually three frequency events that afternoon
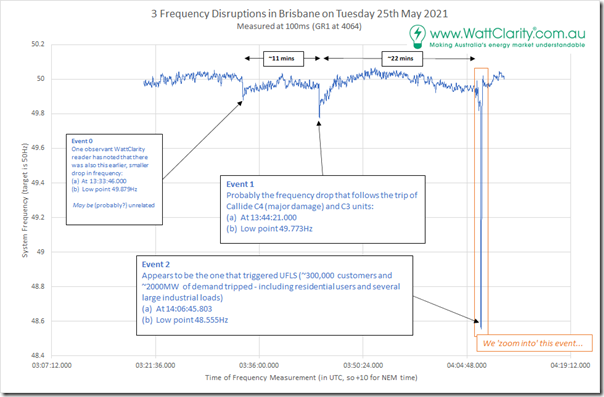
An eagle-eyed reader of the last article pointed out to me that there were actually three frequency events during the afternoon – which I have shown here in an updated chart:
You’ll note I have labelled them Events 0, 1 and 2 as follows:
Event 0 = at 13:33:46.000
Thanks for identifying this, NB (and I note Josh Stabler spotted this here)!
I’ve labelled this ‘Event 0’ as we had already numbered the other two, but also because it is possible (indeed probable?) that whatever caused this drop down was unrelated.
The low point was to 49.879Hz.
Do readers have any idea about what happened to cause this? I have not yet had time to look…
Event 1 = at 13:44:21.000 (Callide C3 and C4)
As discussed already, this is when Callide C3 and C4 tripped (perhaps with C4 actually tripping before C3 … but we’re still looking into that, to see what we can see).
The low point here was 49.773Hz.
Event 2 = at 14:06:45.803 (Many other units)
As discussed already, this is when Callide B2 tripped, along with 3 units at Stanwell (to house load) and 1 unit at Gladstone (and Allan also identified that Yarwun Cogeneration also tripped at the time).
The low point here was 48.555Hz.
(B) It seems QNI separated for ~20 seconds during Event 2
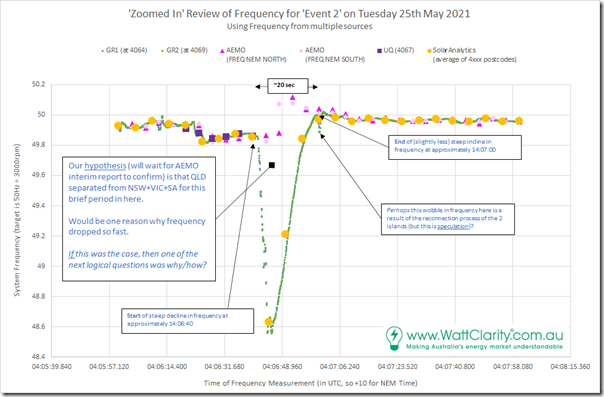
In this next section, we’ll take a closer look at what we can see, in terms of system frequency, for Event 2 (the big one).
We’re having another look for several reasons, including:
1) We’re also in the process of reviewing the AEMO 4-second data (which has been causing a bit of confusion on twitter and LinkedIn, we noted yesterday).
2) We’ve also been receiving a variety of frequency traces from an evolving crowd-sourced approach, whereby a variety of readers are providing us with data from their own solar or battery inverters at a range of locations across Queensland (thanks to everyone individually – and also to Solar Analytics for a large data dump from a few thousand).
It’s pretty clear to us, from the above, that…
(B1) AEMO’s ‘NEM North’ in this instance, was not measuring QLD
As I noted on social media (some links above) that there were a number of people starting to dig into the AEMO’s 4-second data, which is used for the primary purposes of Regulation FCAS ‘Causer Pays’ calculations.
In the data file, the AEMO publishes 4-second frequency readings for 3 locations … and it’s entirely understandable that people conclude that the data set labelled ‘NEM North’ is frequency measured in Queensland somewhere (a logical guess would be Brisbane). However that is not always the case.
Indeed, I have a vague recollection that the measurement of ‘NEM North’ can be switched to Sydney on occasions (don’t recall the specifics – and my memory might not be correct) – as it was a factor in some of the counter-intuitive outcomes out of the Double-Islanding event back on 25th August 2018. Don’t have time to dig into the details now, but it was around AGC signals being sent to QLD Generators supplying Regulation FCAS that asked them to move one way (based on the use of Sydney frequency) whereas the QLD frequency was calling for the opposite direction of support.
Obviously flags the desire to be able to use a greater number of sources in the data set, and the operational systems, but my vague recollection is that there’s some limitation in the EMS.
(B2) The Queensland frequency plunged (and southern frequency rose a bit) when QNI separated
Understanding the above (remember – our hypothesis, at this stage) if seems quite likely that Queensland was separated from the southern NSW+VIC+SA frequency island (TAS is somewhat separate because of the DC nature of Basslink) for a period that we hypothesise was about 20 seconds long, as shown in the chart above.
Assuming that this was the case, then it does lead to some interesting follow-on questions and observations:
(a) The (temporarily) islanded QLD grid would have had a much lower level of latent inertia present in the system:
i. Because of loss of support from the south; and
ii. Particularly after Callide B2, Gladstone 2, 3 and 4, and Yarwun all tripped offline completely;
iii. Plus I’m not 100% sure of what inertia the 3 x Stanwell units would have been supplying (I think it would have been NIL, but my memory is very rusty here – I think they would only have been supplying ‘house load’ and disconnected from the grid to keep them stable and ready to ‘Black Start’ the grid if needed).
(b) This lower level of inertia would have increased (significantly!) the ROCOF … hence the steep decline in frequency.
(c) Should not need to be said, perhaps – with the ‘[SOUTHERNERS] saved the day’ argument going on, worth noting that nothing south of the border could have helped (or hindered) QLD’s recovery for the ~20 seconds after the QNI interconnector separated.
(d) This also helps to answer the (numerous) questions I have seen about why all the UFLS was occurring in QLD – with a bit in northern NSW, presumably because of where the disconnection point was on QNI.
(e) There is also the recurring question (from 25th August 2018) about what was happening with Regulation FCAS …
i. was it asking enabled QLD units to increase their output and raise the frequency (or was it asking them to lower their output, as would have been the case using ‘NEM North’ as the operational guide)?
For those who are new to FCAS, or a bit rusty, Jonathon’s article will help.
ii. even though the separation event appears to have only been 20 seconds long, that would have been 5 or 6 pulses of AGC signals.
My sense is that it’s a wonder the lights did not go out across the whole state, and will look forward to understanding what brave decisions were made to help it remain (mostly) together.
We obviously don’t yet know why the interconnector tripped, but it does seem to be (if our hypothesis is correct) a big determinant on what happened!


Those measurements certainly point to loss of synchronization (est. about 3.8 cycles different at the point of QLD nadir, based on pixel counting your chart). 4 second data also record zero flows on QNI. It would be interesting to know what was going on with voltages, in relation to the transmission line trips. Also loss of synchronization between NSW1 and QLD1 may have been preceded by collapsing voltage on the NSW side, triggering UVLS rather than UFLS.
The AEMO report on the “double islanding” event notes changes were made to the protection scheme “The protection equipment on the Dumaresq – Bulli Creek 330 kV lines operated as designed, although the protection design did not cater for the circumstances of this event. The auto-reclose control for the loss of a single phase of both circuits required a successful synchronism check before reclosing the lines after the fault had cleared. Powerlink and TransGrid have since modified the control logic by reducing the reclose time and not requiring the synchronism check prior to re-closing the CBs.”