This article was originally posted on LinkedIn, where there are other comments. Reproduced here with permission.
As a self-confessed NEM geek who is passionate about the energy transition and new technology (especially storage), the events of Tuesday 13 October in the QLD region of the market provide a fascinating case study. For those unfamiliar with what I’m talking about, a quick recap. The morning started out relatively mild, with spot prices averaging around $25/MWh. At 9.40am, however, the spot price suddenly hit $15,000/MWh – the current market price cap – seemingly out of nowhere. In the following dispatch interval the price dropped back to $17/MWh, before then plugging to the market price floor of -$1,000/MWh for the remaining two dispatch intervals. Overall, the trading interval settled at $2,179/MWh – certainly a departure from the pricing outcomes that have characterised Spring in QLD so far!
I’m not going to explore why this pricing outcome occurred – Paul McArdle has done a brilliant job of this already, and I strongly encourage you to read his analysis of the events here in Part 1, Part 2, Part 3, and Part 4. This was a fascinating event from a market perspective – and perhaps a harbinger of things to come – so is well worth the deep dive.
A quick note first up – throughout the below I will use the abbreviations DI, TI, and VoLL:
- DI = dispatch interval, the 5 minute period in the spot market typically annotated by the time ending (eg. the 9:45 DI is the period 9:40 to 9:45).
- TI = trading interval, the 30 minute period made up of six dispatch intervals, also annotated by the time ending (eg. the 10:00 TI is the period 9:30 to 10:00).
- VoLL = Value of Lost Load, also now known as the Market Price Cap, currently set at $15,000/MWh.
Busy on the phone at the time, I was first alerted to something going on by a flurry of messages in our team Zoom chat. As a spot exposed customer with up to 20MW of load this time of year, the first thing I did was double check our hedging position for the quarter! Thanks to a robust risk management framework though we were all good in that department, with a mix of swap and cap positions in place.
UQ battery performance
The second thing I checked was how our 1.1MW/2.2MWh St Lucia battery had performed. Our autonomous Demand Response Engine (DRE) algorithm responded to the sudden price spike as soon as it was received from AEMO and immediately began discharging for the rest of the trading interval. In total it captured around 19.5 minutes out of 20 at full discharge once the price spike was received just after 9:40. As seen in Figure 2, the battery then swung to begin charging for the following two trading intervals, achieving an average charge price of around $11/MWh. In the TI ending 10:00 (when the price spike to VoLL occurred), the battery earnt $786 from discharging – not a bad morning’s work.
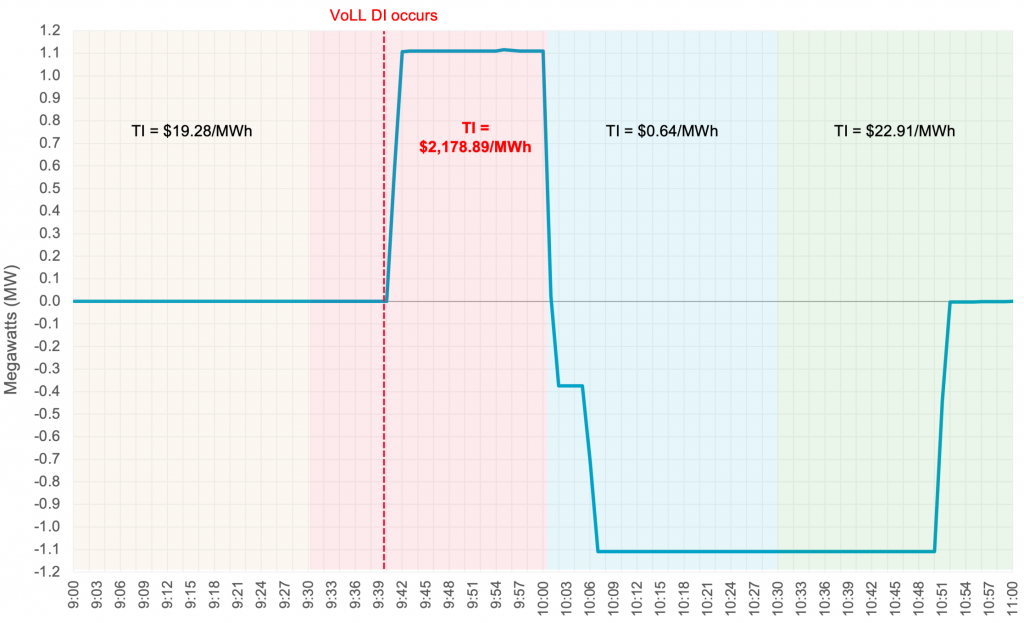
Figure 1: St Lucia battery power profile on the morning of 13 October
Whilst a great result for the battery, it’s an interesting hypothetical to look at how these events may have played out in the rapidly approaching world of 5 minute settlement. Across the TI ending 10:00, the battery discharged 0.361 MWh, earning $786 in revenue as it optimised its position across the 30 minute settlement period. On a dispatch interval basis across the same period, however, there is a high probability DRE would have directed the battery to discharge ~0.0925 MWh at +$15,000/MWh in the 9:45 DI, sat idle in the 9:50 DI, and then charged ~0.185 MWh at -$1,000/MWh during the 9:55 and 10:00 DIs. This would have resulted in revenue for the half hour of $1,572 – double what was achieved on a 30 minute settlement basis.
It’s important to note that 5 minute settlement will inevitably introduce new market dynamics from participants. This means spot pricing outcomes may very well have been different. This exercise nonetheless illustrates how the current 30 minute settlement rules disadvantage those assets with the highest levels of flexibility and speed of response. More information about the 5/30 issue and how it impacts batteries can be found here.
Peaking plant performance
After checking on our own portfolio’s performance, I got to wondering how other assets within the market had performed during this largely unexpected pricing event. This is of particular interest with an eye to what it may mean as we get deeper into the energy transition and factors like increased use of constraint equations and 5 minute settlement come into play.
First up let’s take a look at the QLD assets that would be considered as ‘peaking’ plants – those that run at low capacity factors only when demand and/or prices are high, and who might be typically be expected to sell cap contracts or provide physical hedging cover for their owners against market volatility. The plants considered in this analysis are:
- Braemar 1, 2 & 3 (Open Cycle Gas)
- Braemar 5, 6 & 7 (Open Cycle Gas)
- Oakey 1 & 2 (Open Cycle Gas)
- Mackay GT (Fuel Oil)
- Mt Stuart 1, 2 & 3 (Kerosene)
- Roma 7 & 8 (Open Cycle Gas)
- Swanbank E (Closed Cycle Gas)*
- Wivenhoe 1 & 2 (Pumped Hydro)
(*Note that as a CCGT plant, Swanbank E wouldn’t traditionally be considered a true ‘peaker’ but is often traded in a flexible manner as a kind of ‘semi-peaker’ and has been included in this analysis for interest).
These generating units have a maximum nameplate capacity of just under 3 GW in aggregate.
Of these units, only Braemar 3, Braemar 5, Braemar 7, and Mackay GT responded to the price spike during the 9:45 DI. Swanbank E was already running and also responded by ramping up its output. Interestingly, Wivenhoe was actually pumping during the DIs ending 9:40, 9:45 and 9:50! This was due to PUMP1 having a dispatch target that was set at 9:35 (in the DI ending 9:40), meaning it was ramping up to its target level of pumping between 9:35 and 9:40. If this was part of a planned start to pumping for the day (which is typical of how the plant has operated recently), it turned out to be terrible timing! It re-bid this capacity as soon as the price spike occurred, and ramped back to zero as quickly as it could. These circumstances could partially explain why the Wivenhoe generating units did not dispatch during the half hour trading interval.
The generation profile of each unit is illustrated in Figure 2 as follows. Note that each unit’s output has been normalised as a % of nameplate capacity to help with visitation – negative values represent load rather than generation (ie. pumping).
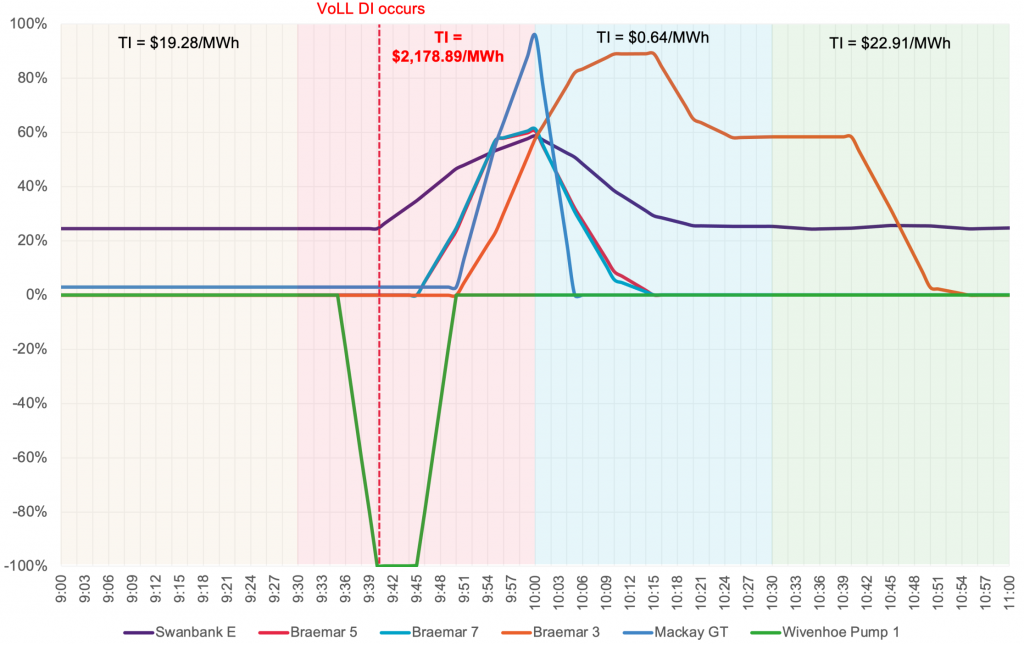
Figure 2: Output of QLD peaking plants in response to the VoLL price spike at 9:40
In total, output across peaking plants maxed at 578MW – just over 20% of the aggregate nameplate of all plants. Looking only at the units that dispatched (incl. Swanbank E but excl. Wivenhoe Pump 1), total output peaked at just over 60% of nameplate. Notably though, this peak output occurred during the 10:05 dispatch interval – right at the end of the trading interval that settled at $2,179/MWh, but too late to benefit from sustained output at these prices. The units then began gradually ramping down during a trading interval that ended up settling at just $0.64/MWh. Considering fuel and other O&M costs for these assets, this almost certainly translated to a loss for any MWh that were dispatched between 10:00 and 10:30. The aggregate generation profile of these assets is shown in Figure 3, again normalised as a % of nameplate.
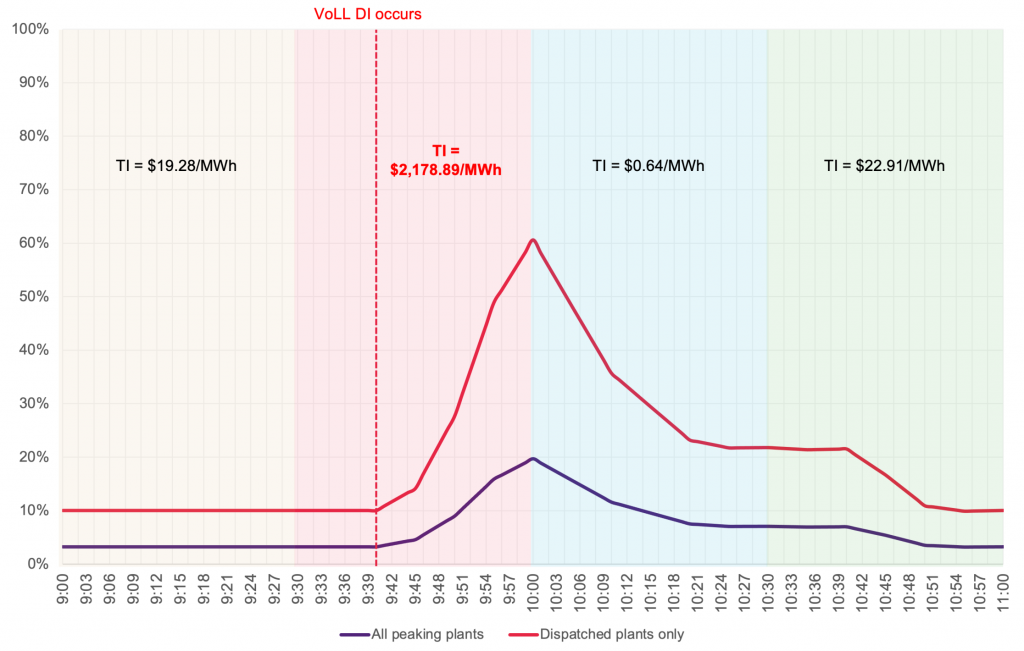
Figure 3: Aggregate output of QLD peaking plants
For interest, we can also look at how other types of generation assets reacted to the price spike. I’ve shown Millmerran Unit 1 in Figure 4 as an example, partly because it is one of QLD’s newest black coal plants, as well as exhibiting one of the clearest responses to the price spike. It had been ramping down prior to the price spike and, as with the peaking plants, didn’t complete it’s ramp up to full output until after the end of the relevant trading interval, taking some time to then ramp back to previous output levels despite the very low spot price.
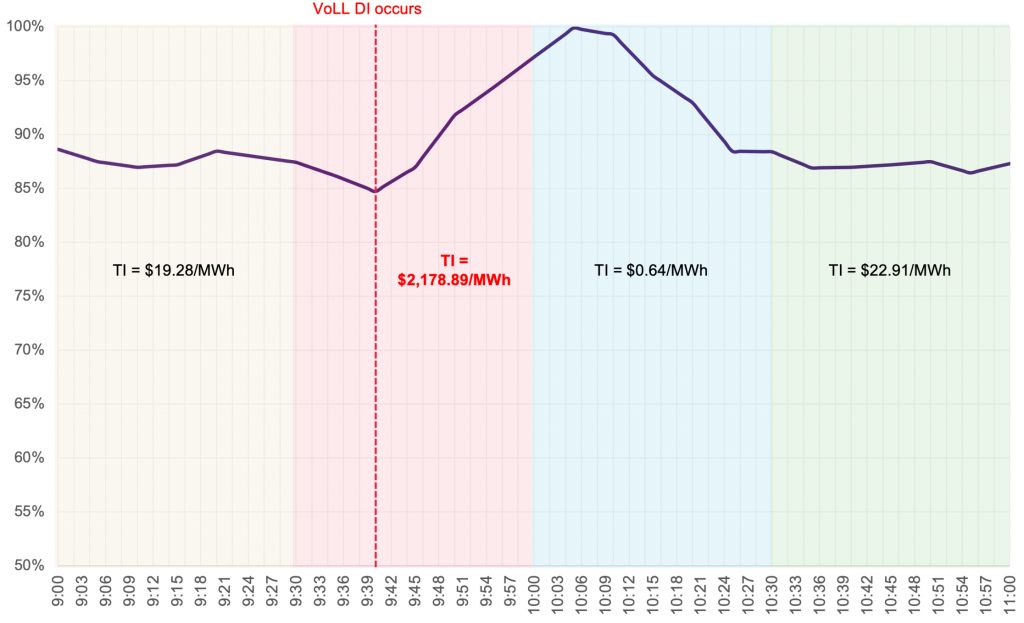
Figure 4: Output of Millmerran Unit 1 in response to VoLL price spike at 9:40
There are many factors that will have contributed to why each unit reacted (or didn’t react) the way it did, many of which are difficult to discern as an outsider. Paul McArdle’s Part 4 analysis does a good job of looking at all of the factors that the public can see that help inform this (albeit one day later, rather than in real time).
Despite the many questions still remaining about the market response to this event, what is clear is that start-up time and ramp rate constraints placed hard limits on how aggressively the peaking units within the region could respond to:
- take advantage of high prices*, and
- fill the gap in supply caused by the sudden withdrawal of capacity in North QLD.
(*The market price shot from $31/MWh to $15,000/MWh exactly because of the influence of these start-up and ramp rate constraints on a sudden supply/demand imbalance. In a future NEM where more flexibility is present, it’s possible this price spike may not have occurred, or would have been lessened. This analysis looks at the NEM as it exists today though.)
UQ battery vs. peaking plants
Considering the above factors, it is of interest to look at how the peaking plants throughout the region responded compared to UQ’s battery. A caveat: the battery is a behind-the-meter asset that isn’t required to participate in the dispatch process – it can behave as it sees fit in response to events as a ‘price taker’. To account for this, I’ve slightly adjusted the battery’s output in the figures below to assume that it did have to participate in the dispatch process. In this case, the battery would have had a standing bid for its full output at an appropriate price band (eg. >$300/MWh) and, due to nil start-up time or ramp rate constraints, would be able to linearly ramp between zero and full output during the 9:40 to 9:45 DI. Likewise with ramp down, this would follow a linear dispatch target back to zero (or full charging) rather than being instant, as in Figure 1 above. The performance of the UQ battery adjusted in this way versus the region’s peaking plants is shown in Figure 5 as follows.
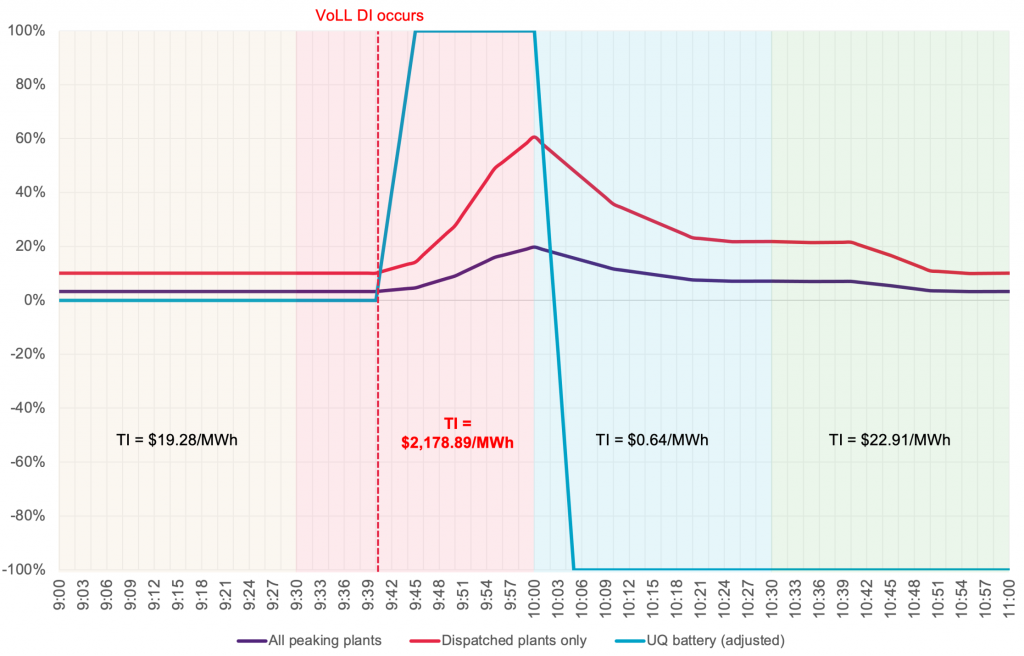
Figure 5: Peaking plants vs. UQ battery (adjusted) in response to VoLL price spike at 9:40
As seen above, the battery is substantially more effective than other peaking plants at responding to the unexpected price spike, and is able to be at full output within 5 minutes of this event occurring. The absence of constraints on start-up time or ramp rate results in a substantially higher revenue capture – both for the overall 30 minute trading interval, as well as for the four dispatch intervals after the price spike occurred. Figure 6 shows a comparison of the portion of revenue captured by each plant compared to a theoretical maximum assuming full nameplate output for the relevant time period.
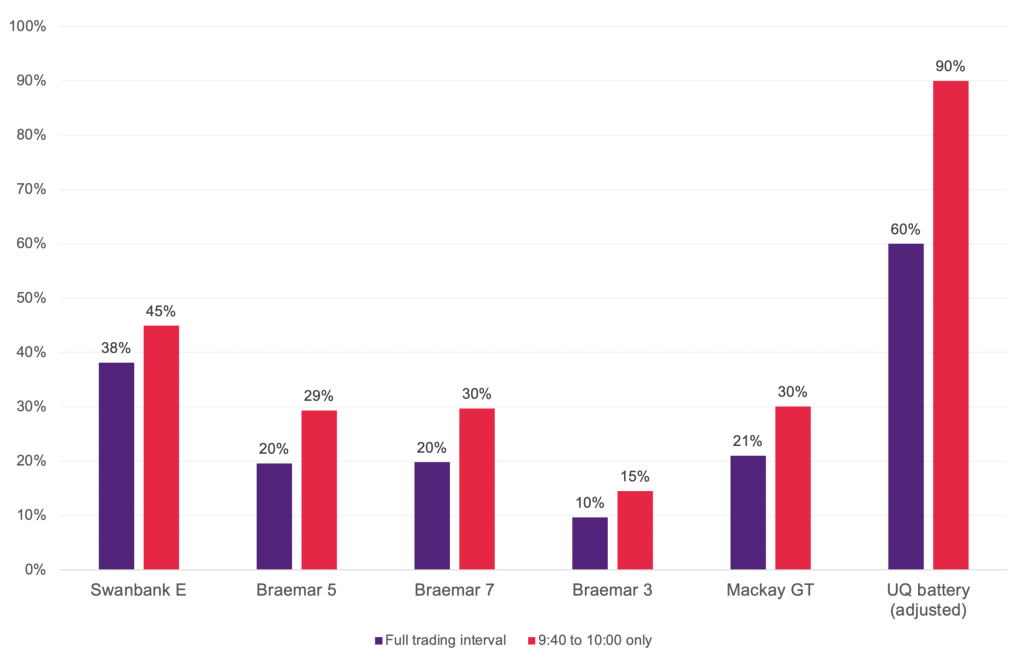
Figure 6: Portion of revenue captured compared to theoretical maximum
Even when adjusted to account for dispatch targets and a linear ramp profile, the battery is able to capture twice as much revenue than Swanbank E (who was already running), and at least three times more than those peaking plants who had to start from cold.
Final Thoughts
The events of 13 October represent an interesting case study from many angles. It’s not unreasonable to expect that as the energy transition hastens – and the use of constraint equations becomes more common – similar market events may occur more frequently. The change to 5-minute settlement from 1 October next year is another factor that may result in more short term (eg. 5 minute to 5 minute) volatility that is difficult to forecast, especially when supply and demand are being increasingly driven by the weather.
This presents both challenges and opportunities for all market participants, and existing peaking plants may struggle in this new world. Whilst they do offer clear benefits such as effectively infinite dispatch duration (pending fuel availability), they are challenged by hard constraints on start-up times and ramp rates. Similarly, while batteries are highly advantageous from a speed of response perspective, they face other challenges such as limited storage capacity (and thus run time), and the need to be ‘charged’ ready to go for unexpected pricing events.
The difficulties faced by plants of all types in being able to respond to market volatility will have flow on impacts to issues such as to the price and liquidity of the cap market, or the ability for participants to be able to physically hedge their exposure. This may then have flow on impacts to other products like swap contracts – a counterparty unable to effectively protect their position in a volatile market may be more reluctant to sell hedging products, or require a higher price to do so.
There’s no doubt that the coming years are going to present challenges for incumbents and opportunities for new technologies, and will certainly be fascinating to watch play out.
——-
Some fine print about the data: All market data was derived using the Global-Roam software suite. Output of each plant has been time-shifted to reflect the fact that the ‘Initial MW’ values used represent the output of the plant at the start of a given dispatch interval – for example, the ‘Initial MW’ value in the DI ending 9:45 represents plant output at 9:40. The plant output at the start of the following DI is then used to assume a linear ramp profile for the period in between each data point available from the market data. Finally, it’s important to remember that it’s impossible to know with 100% confidence why a certain unit or market participant did or didn’t respond in a certain way, so any external analysis of market outcomes should keep this in mind.
————————————–
About our Guest Author
 |
Andrew Wilson heads corporate energy & sustainability at The University of Queensland (UQ) and is Project Director of the 64 megawatt Warwick Solar Farm. He and his team are leading a world first initiative for UQ to become a 100% renewable ‘Gensumer’ – playing on both sides of the energy market as a large energy generator and large energy consumer, utilising energy storage and demand response to help deliver UQ’s operational energy needs in a flexible, sustainable, and lowest cost manner. |


Good post. Confirms what we have all been saying. For this sort of price spike batteries can’t be beat by any other currently available technology. That said I wonder if any demand response was able to take advantage of the short intervals.
In terms of Demand Response, David, there was definitely some – as noted in Part 2 of the Case Study here:
https://wattclarity.com.au/articles/2020/10/casestudy-p2-rooftoppv-kills-largesolar/
Great to have Andrew contribute this ‘Part 4B’ (in a way) in the evolving Case Study.
Readers should also keep in mind that UQ’s St Lucia battery is also not scheduled (i.e. not even registered with AEMO, so able to operate completely independently of the AEMO’s dispatch process – because it is under the AEMO’s 5MW registration threshold for BESS).
These two differences (i.e. size (re: size of market need), and type of participation) are other difference to consider in the considering what happened on the day … especially if thinking through the ‘if I also had a battery, it’s performance would have been X’ extrapolation.
It is interesting that the battery benefits in 2 ways from slower response times of traditional peaking units: from the obvious ability to capture high prices during supply shortfall; and also from “artificially” lower prices due to the slower ramp down response of the traditional units after the VoLL event. Perhaps it should have to pay a “corrected” price for recharging in the latter case.
Very interesting and well written article Andrew.
As you point out, the bidding dynamics and dispatch outcomes that will occur under 5 minute settlement (5MS) could be quite different because the financial incentives for participants will be driven by the 5 minute dispatch price not the 30 minute average trading price. I think one of the current uncertainties with 5MS will be how operators of traditional peaking generation decide to offer and run their capacity – for example they may have to bid “more cautiously” as they won’t be able to rely on “catching up” to 5 minute spike early in a Trading Interval by starting up in the later DIs of that TI.
It’s also worth noting that although limited ramp rates and start up times for peaking (and online thermal) plant probably were a factor in driving the dispatch price to $15,000/MWh when the northern Queensland solar plants were constrained down, it was presumably the very high downward ramp rates of those solar plants that required very sudden upward dispatch of the rest of the generation fleet. If the solar plants had offered slower ramp rates (downwards) to the dispatch engine or if AEMO’s constraints were less binary in formulation, then the price spike probably wouldn’t have occurred. Sometimes very fast fast ramping can be too much of a good thing :).
Allan
“MR ALLAN G O’NEIL” – lol autofill fail