
Yesterday marked another day in Australia’s energy records, along the Eastern seaboard. The hot and sunny conditions led to notable maximums in energy demand and supply.
Key Records Broken:
- NEM’s (National Electricity Market) Record: We witnessed the highest ever 5-minute Native Demand [1] in the history of the NEM. This surpasses the previous record set on 31st January 2020, just before the onset of the first Covid lockdown. This milestone illustrates a remarkable rebound and growth in energy demand.
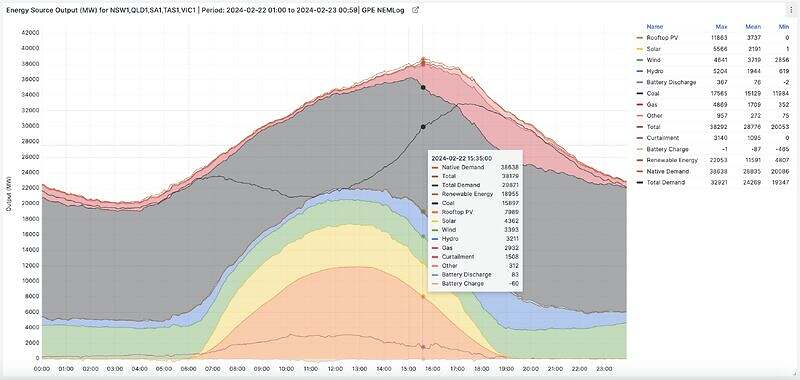
- NEM’s (National Electricity Market) Record: We witnessed the highest ever 5-minute Native Demand in the NEM’s history. This peak reached 38,638.0 MW on 22nd February 2024 at 15:35 hrs, slightly surpassing the previous record of 38,601.2 MW set on 31st January 2020. This is a 0.10% increase and marks the first time the maximum has risen past the pre-Covid 2020 lockdown record.
- Victoria’s Native Demand: Victoria also experienced its highest 5-minute Native Demand, reaching 10,972.5 MW on 22nd February 2024 at 15:35 hrs. This is an increase of 540.8 MW (5.18%) from the previous record of 10,431.7 MW on 17th February 2023, aligning with the hot weather over a number of days during the working week.
- Renewable Energy and Curtailment in Victoria: In addition to demand records, Victoria set a new record in Renewable Energy (RE) plus Curtailment, hitting 7,335.4 MW on 22nd February 2024 at 13:25 hrs. This is up by 419.64 MW (6.07%) from the previous record of 6,915.7 MW on 13th February 2024. . This highlights the growing contribution and impact of renewable energy in the region’s energy mix.
As always, these records reflect the evolving energy landscape in Australia, the resilience of our infrastructure, the changing patterns of consumption and a recovery from the pandemic, now a distant memory. They also underscore the importance of robust energy policies and the increasing role of renewable sources.
Note: We currently use a basic interpolation method to derive 5-minute values for Rooftop PV, acknowledging that it’s not ideal but necessary given the limitations of the data provided by AEMO. This approach, while a compromise, allows us to construct a more comprehensive picture of electricity demand, incorporating the significant yet underrepresented impact of distributed energy resources like rooftop PV. We hope that in the future, AEMO will supply more granular rooftop PV data, enhancing the accuracy of our demand metrics and our understanding of the NEM’s dynamics. Until then, we must work with the best available data, balancing the ideal against the practical realities of data availability and resolution in the evolving energy landscape.
[1] Native Demand = Total Demand + Non-Scheduled Generation + Rooftop PV (Behind the Meter)
This has also been published on Linkedin, where there other comments.
About our Guest Author
 |
Geoff Eldridge is a Principal Advisor at Global Power Energy. He is an experienced utilities analyst with over two decades of experience
You can find Geoff on LinkedIn. |
Be the first to comment on "Yesterday’s Record-Breaking Native Demand for Australia’s NEM and Victoria (22nd Feb 2024)"