Only a week ago (on Sat 29th Aug 2020) we saw VIC demand drop to what I thought was a new day-time record low in NEM times. The level then (2,992MW at 13:05) was just above two other previous ‘all hours’ low points:
1) at 05:55 on 12th June 2000 where the Scheduled Demand* dropped to 2,941MW; and
2) at 04:00 on 2nd January 2017 where the Scheduled Demand* dropped to 2,940MW:
* For those who forget the many different ways in which electricity demand is measured, here’s the detailed explanation.
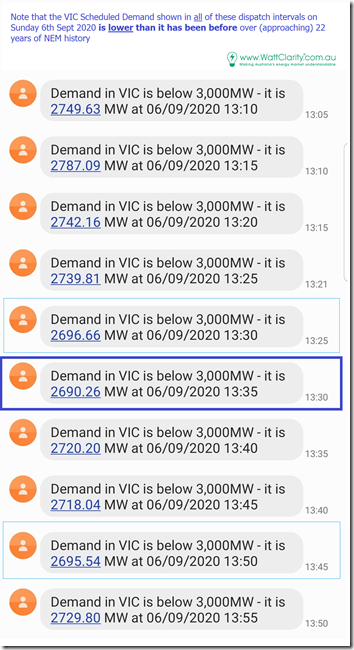
Well, in the ‘slowly, than suddenly’ nature of this energy transition, barely 8 days later and we see that all 3 of these ‘low point’ marks have been shattered, with the Scheduled Demand dropping to a significantly lower mark of 2,690MW at 13:35 today. That’s 250MW lower than the prior low marks!
This was captured in the SMS alert delivered to me as one of many through the afternoon:
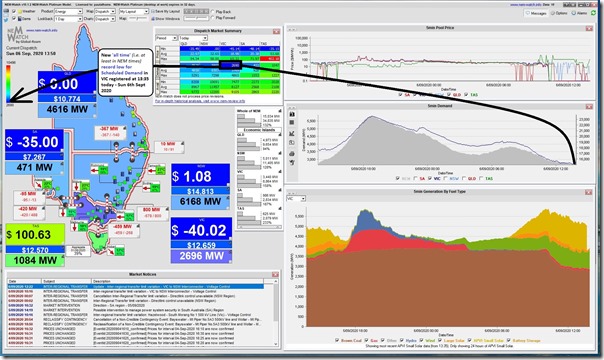
… and here’s that mark visible in the 13:50 dispatch interval in this snapshot from the NEMwatch v10 foyer dashboard:
We see a continuation of the low, and negative prices which are been experienced increasingly frequently across all regions of the NEM. Like a large industrial game of ‘chicken’ with billions of dollars of assets…
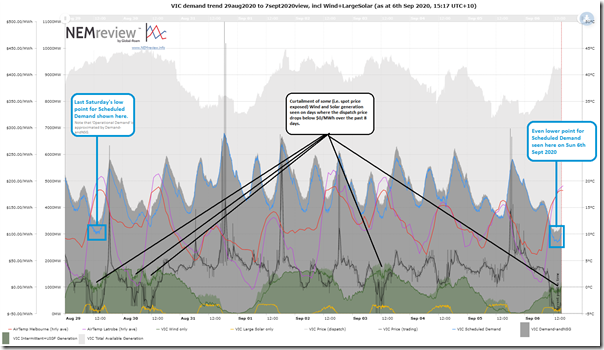
For those who think moreso in terms of Operational Demand (i.e. grid demand, as distinct from market demand) here’s a trend of the past 8 days showing the trend in a proxy for Operational Demand at a dispatch interval level:
This was generated from this trend query in NEMreview v7.
————–
Note that I followed up last Saturday’s low point with this ‘Part 1’ of a deeper exploration last Sunday. Barring other distractions, I should have ‘Part 2’ up before too much longer – lots to explore on that day (and would expect the same for today, as well).


It is a game of chicken indeed when you look through the other end of the telescope at dinnertime and see the contribution from wind power when there is little or no solar input. The game gets serious during the frequent and prolonged “wind droughts” when the wind farms are producing little or no power, often under 10% of plated capacity and occasionally much lower. Have a look at June and July. It is necessary to take account of those drought periods and also the “choke point” factor, meaning that the grid needs continuous input in the same way that our lungs need a continuous supply of air and we can choke to death very quickly if the supply is arrested by choking or drowning. As long as we have 100% of demand available from conventional sources the grid will not choke but when we lose conventional power capacity then the wind becomes essential and the sustainability of the system will be limited by the lowest level of wind supply, not the average or the plated capacity.