Following the cancellation of this year’s Large-Scale Solar Forum the Clean Energy Council is running a webinar series. It starts this Thursday 21st May 2020 with “Maximising Value in the NEM” which I’m presenting with Jonathon Dyson. Here’s a peek into one of the topics we’ll be discussing.
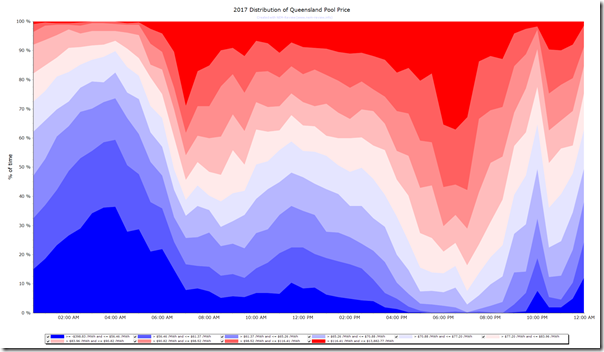
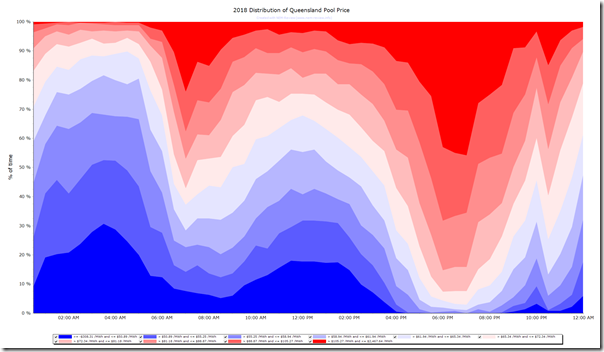
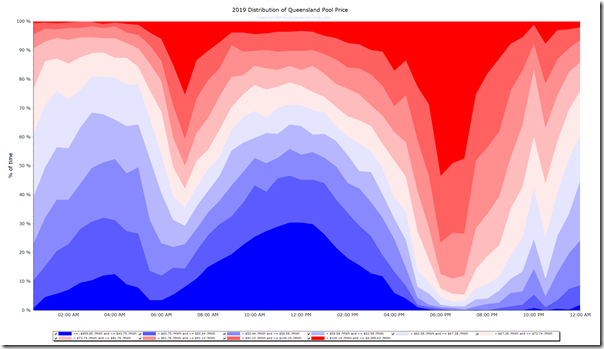
I came across a charting function while testing an upgrade to NEMreview v6 that nicely tells this story about the rapidly changing QLD spot market. The graphs below show the distribution of all half-hour prices across the year arranged by time of day, with the dark blue band showing the incidence of the lowest 10% of prices for the year. This isn’t looking at average prices but at when it’s more lucrative to generate.
2017
In 2017 the lowest prices were clustered around 4 am, the traditional low-demand period in the NEM.
2018
In 2018 we see more of the lowest prices occurring in the middle of the day, and speculate this is due to increasing rooftop PV reducing midday scheduled demand.
2019
In 2019, when hundreds of MW of large-scale solar came online, the middle of the day far overtakes 4 am as the time for low prices.
2020 ???
What will 2020 hold for solar farm operators, and what does this changing distribution mean for the power system, as generation capacity continues to increase at times of the day where the market is already well supplied?
Echoing what Allan O’Neil said in this article, the NEM is a market where details matter. The average market price is only part of the story, as the distribution of prices across the day is critical to generators such as conventional solar farms that are limited in when they’re able to generate. Looking further at the 2019 graph the highest prices (the dark red) are clustered shortly after the sun goes down for the day. A couple of hours of storage could make a big difference to the value a solar farm can create.
You can register for Thursday’s webinar and the remainder of the series with the CEC here.


I enjoyed this article and the webinar, thank you.
I’m aware of the many reports raising the issues that rooftop solar is bringing to the NEM and the SWIS.
Has there been any consideration on what is the
economic limit for semi-scheduled generation? I mean how can a solar farm, like the new one being built in the Western Down of QLD make money when the spot market is heading to zero during the day?
This is partly a rhetorical question because I’m aware that the QLD government has a 10yr PPA for most of the output. It is likely above market price, if so I call it a subsidy. I also would like to know what price the PPA set for the RECs, and if that price reflects a realistic market value.
But there is no slowdown in rooftop solar, so how do private entities make money out of a solar farm?