Following on from Paul McArdle’s on the day note about South Australia becoming separated, or “islanded”, again from the rest of the NEM yesterday, I’ll have a fuller look here – but still a somewhat rushed one – at what happened on Monday 2 March 2020.
What island?
First up let’s clarify what we mean by “islanded”. SA is connected to Victoria and thence to the rest of the NEM by two interconnectors, the main AC (alternating current) interconnector via South-East SA and Heywood in Victoria, and the smaller DC (direct current) interconnector from the mid-North of SA into Victoria’s North West, known as Murraylink. It’s the Heywood AC interconnector that maintains system frequency in South Australia in lockstep with the rest of the mainland, and (in layperson’s terms) balances small unders and overs in demand versus supply with near-instantaneous moves in power flow which are a direct physical consequence of the AC interconnection.
When the flow path via Heywood fails – as it did at around midday (NEM time) yesterday, for reasons which are not yet clear – South Australia and the rest of the NEM are no longer locked in frequency and no longer able to balance those overs and unders across an interconnector (Murraylink does not respond to frequency changes at either end with offsetting changes in power flow).
This means that for a whole range of important factors related to system security – the real time ability of the SA grid to maintain its robustness to events like generation, load, or transmission trips – South Australia is effectively on its own, and has to maintain all the necessary security margins and ancillary service capabilities within its own borders. This is what we refer to as “islanded”, and it’s important because it affects how the system has to be run not only after separation, but also beforehand when that islanding is a “credible” (or single-factor) risk.
Before the event
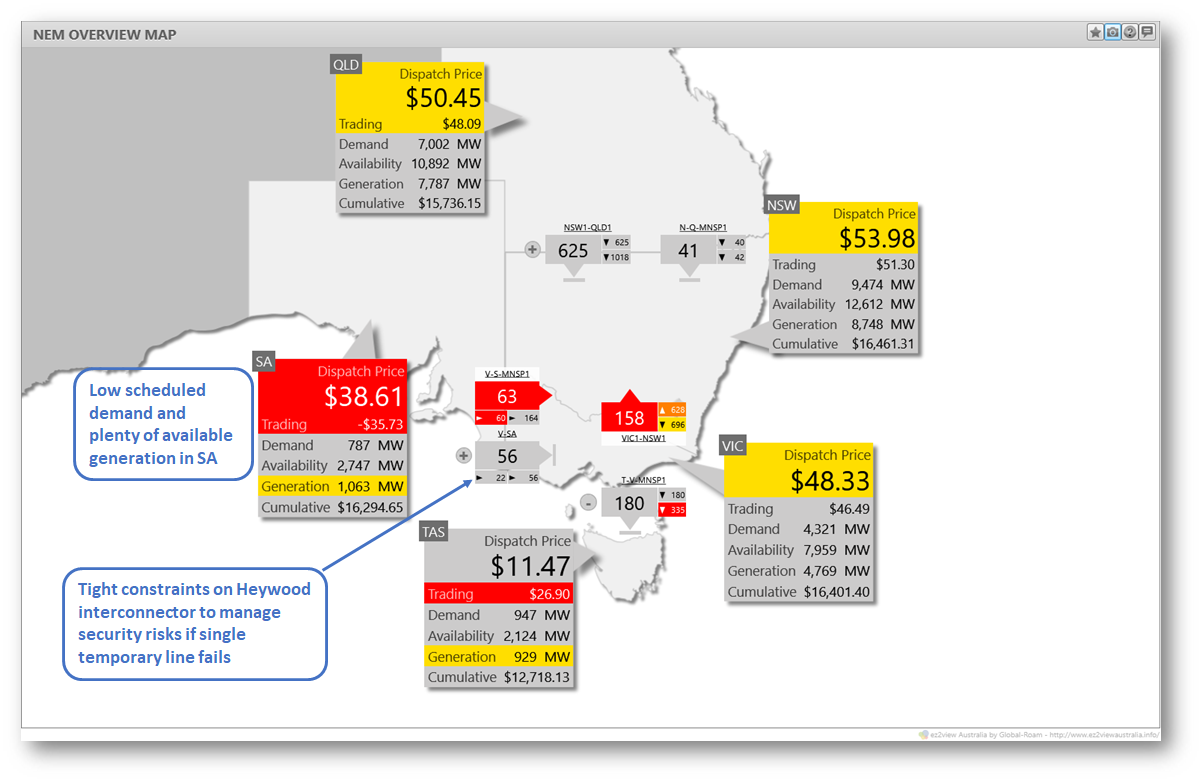
The most obvious outward sign that AEMO was operating the system on an appropriately conservative basis can be seen in this ez2view snapshot of the NEM at midday yesterday, just before the connection through Heywood opened:
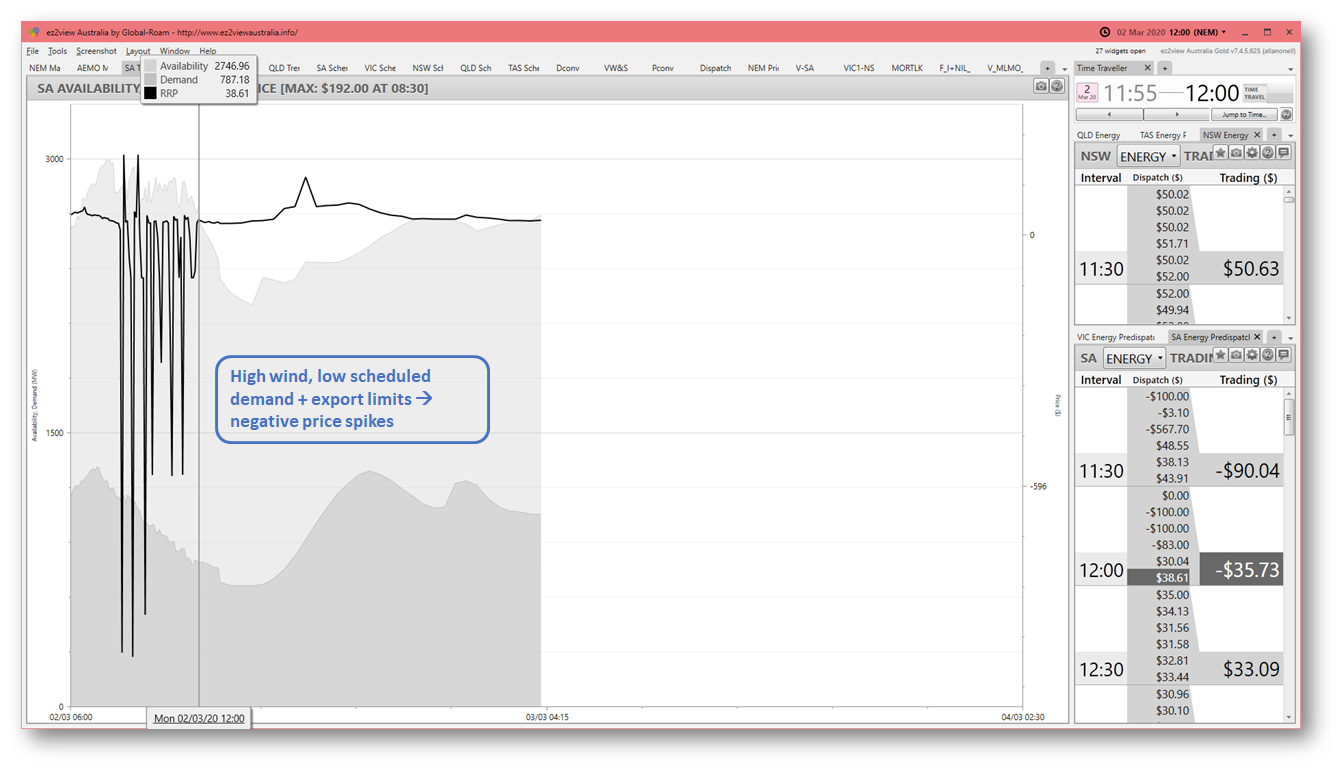
Here we can see that despite low scheduled demand in SA – under 1,000 MW – and plenty of available generation, including lots of zero-marginal cost wind, exports on the Heywood interconnector were being tightly limited. Normally this link could carry up to 500-700 MW but with only a single temporary bypass line around the section of collapsed 500kV towers in Victoria, the risks of unexpected disconnection are much higher than usual, and AEMO limits flows to reduce attendant security risks.
This restriction along with the low demand and bountiful wind had already been having impacts on the energy price in South Australia, as seen in this ezview trend chart for demand, generation availability, and price:
As scheduled demand on the grid fell away over the morning – driven by mild weather and high rooftop PV output (which effectively reduces “demand” as defined in the wholesale market – see Paul’s detailed demand explainer for the reasons why, and lots more) – prices had already jagged down multiple times towards the market price floor of minus $1,000/MWh.
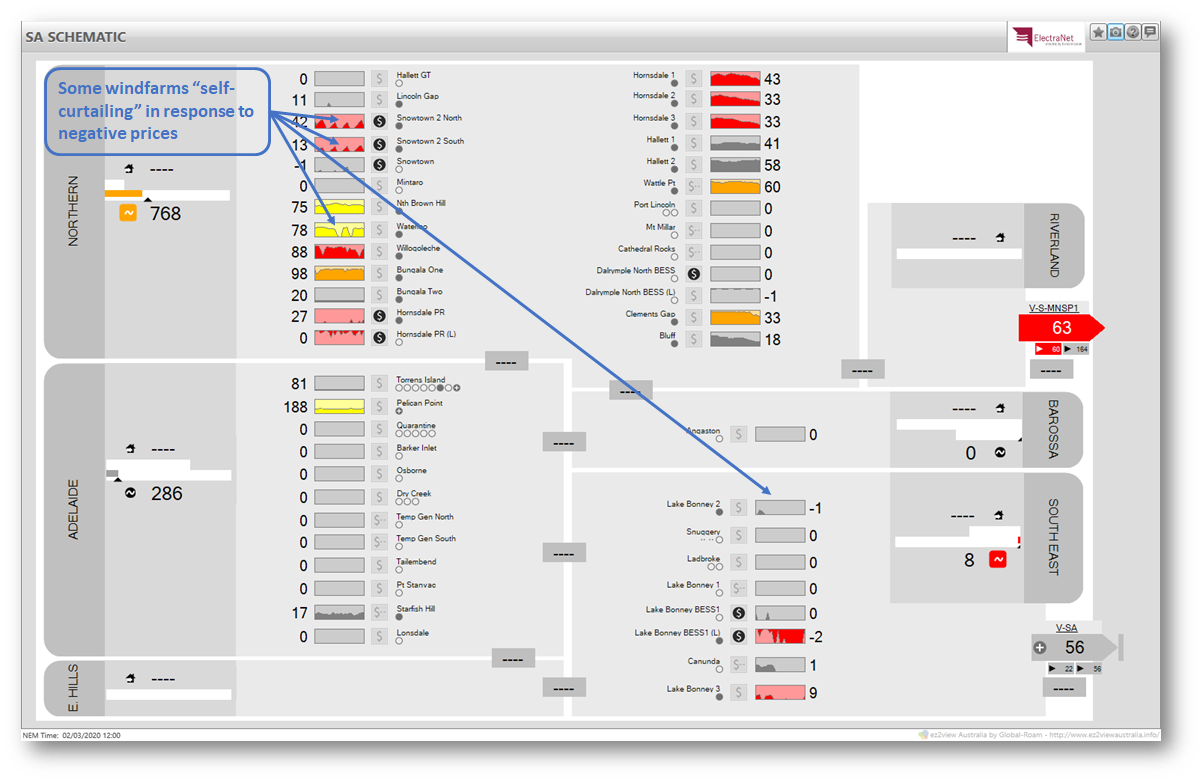
This in turn had drawn responses from a number of the wind generators in SA, as shown by their output trend mini-charts in the ez2view schematic for the state:
To avoid paying AEMO up to $1,000/MWh for the privilege of generating, the charts show a number of the windfarms cutting their output either at times of negative price or right through the period of downside volatility.
This schematic also shows relatively low levels of gas-fired synchronous generation running – not surprising given the low prices and ample supply. In fact most of that gas generation had been directed to run by AEMO, as part of (in effect) out-of-market arrangements to maintain system security parameters, in this case system strength and inertia levels.
The island forms
Just after the time of the snapshots above, the interconnection via Heywood opened and SA “islanded”, as announced in AEMO’s Market Notice at 12:22 –
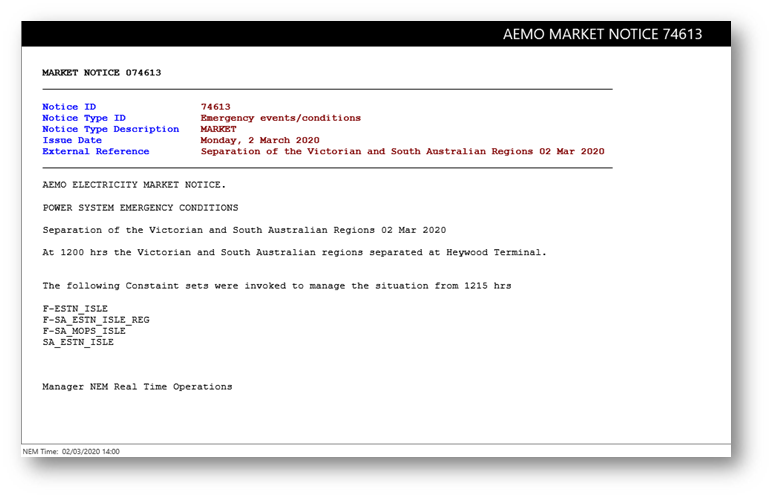 An important detail here is that the separation took place “at Heywood Terminal” – not near the location of the temporary line placement which is well to the east within Victoria. Importantly this means that the Portland smelter retained supply.
Island Trends
To provide an overview of what happened subsequently, I’ll switch to a trend chart from NEMreview v7 covering the whole period prior to and after separation: 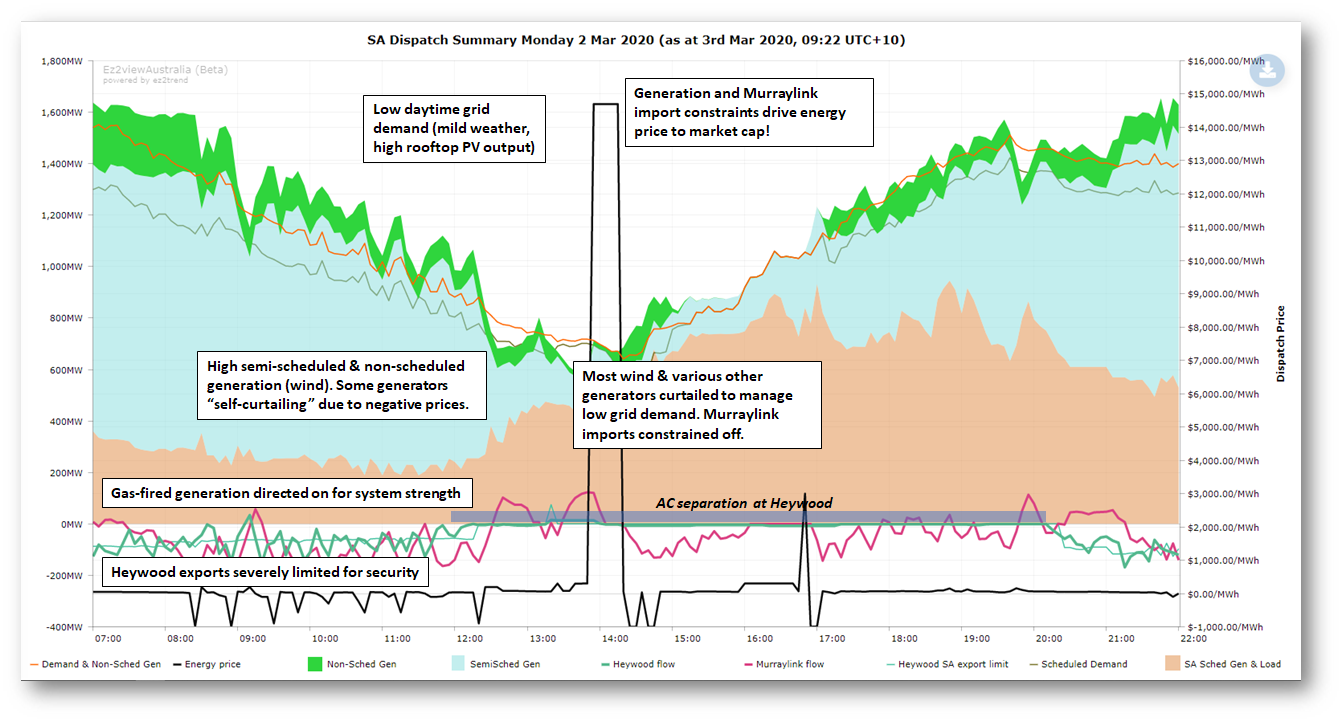 Lots of data presented here and time restrictions prevent me going through it fully, but the key features visible are:
- Heywood flows going to essentially zero – no surprise there
- significant reductions in wind generation and increased gas-fired output – more below on the reasons for this, the notes on the chart give some indications of why
- no immediate reaction in the spot price until at around 14:00 NEM time (actually dispatch interval 13:55) it leaps to the market price cap – again, more explanation below
- readers with a very keen eye will also notice that from just after 14:00, flows on Murraylink seem only to be zero or exporting from the region even when the SA price is high
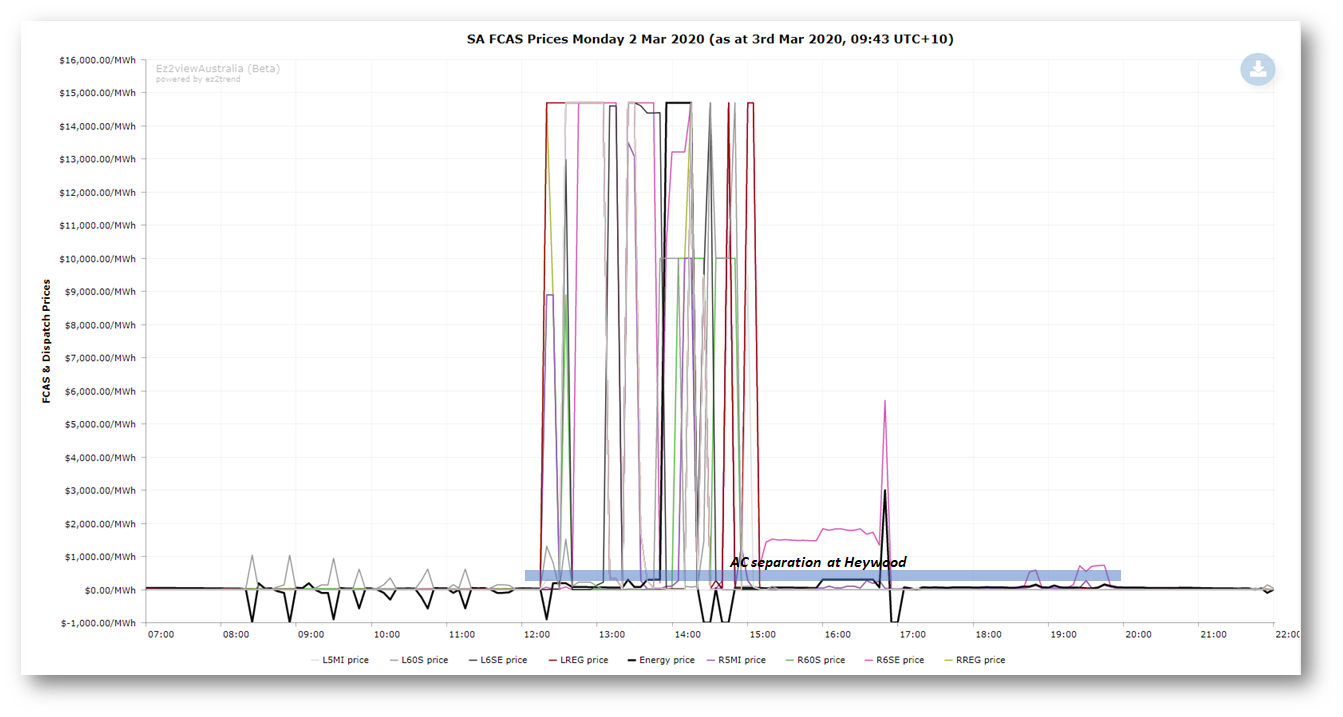
But to use my own words, “Don’t forget about FCAS” – the previous chart showed only energy price and dispatch volumes. As my linked article explained, when SA becomes an island, prices for these less-visible but still critical ancillary services can leap wildly:
A clue to why this is the case is seen in this NEMreview chart of FCAS service volumes dispatched (enabled) in SA, showing a large overall increase not long after the separation event, as AEMO imposed market constraints requiring more of these services to be supplied from within South Australia, as they could no longer be transferred from the rest of the NEM across the AC Heywood interconnection:
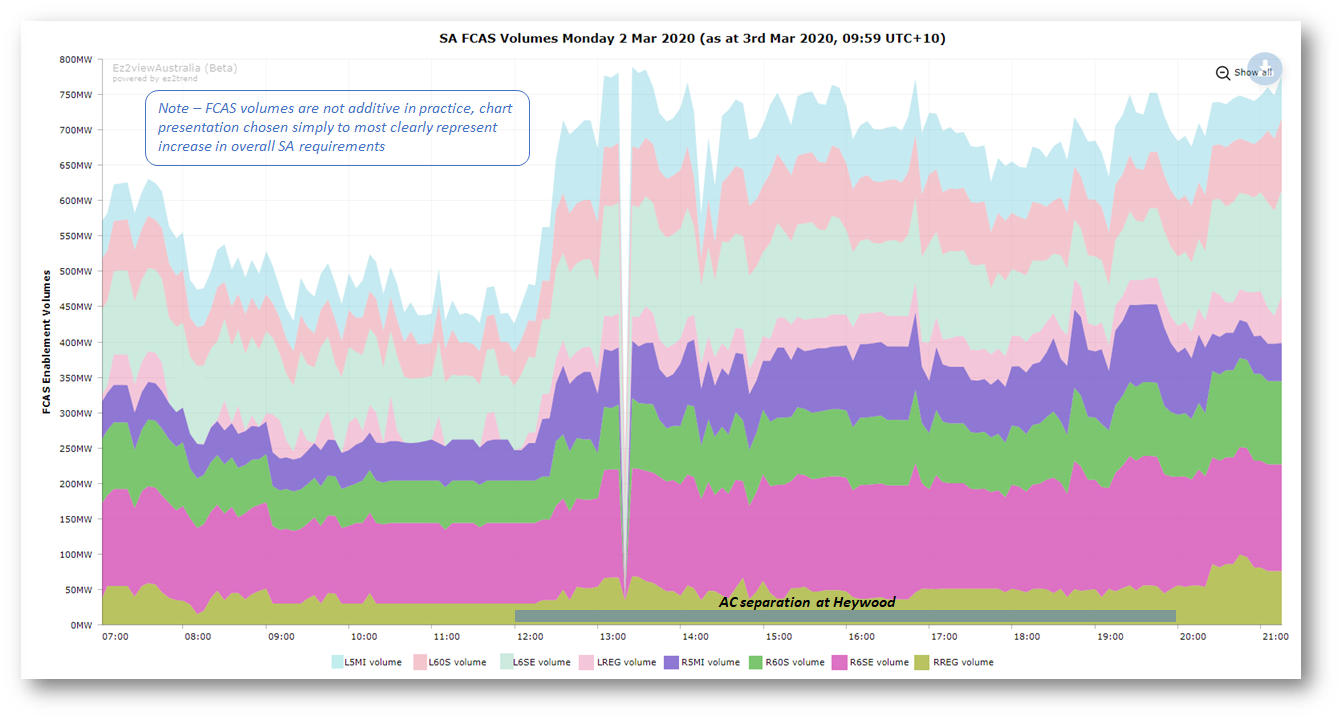 My linked article on FCAS explained in some detail how the greatly elevated costs of certain FCAS services (the “contingency raise” group) impacted on generators, who are liable for a share of costs which is basically proportional to their share of generation.
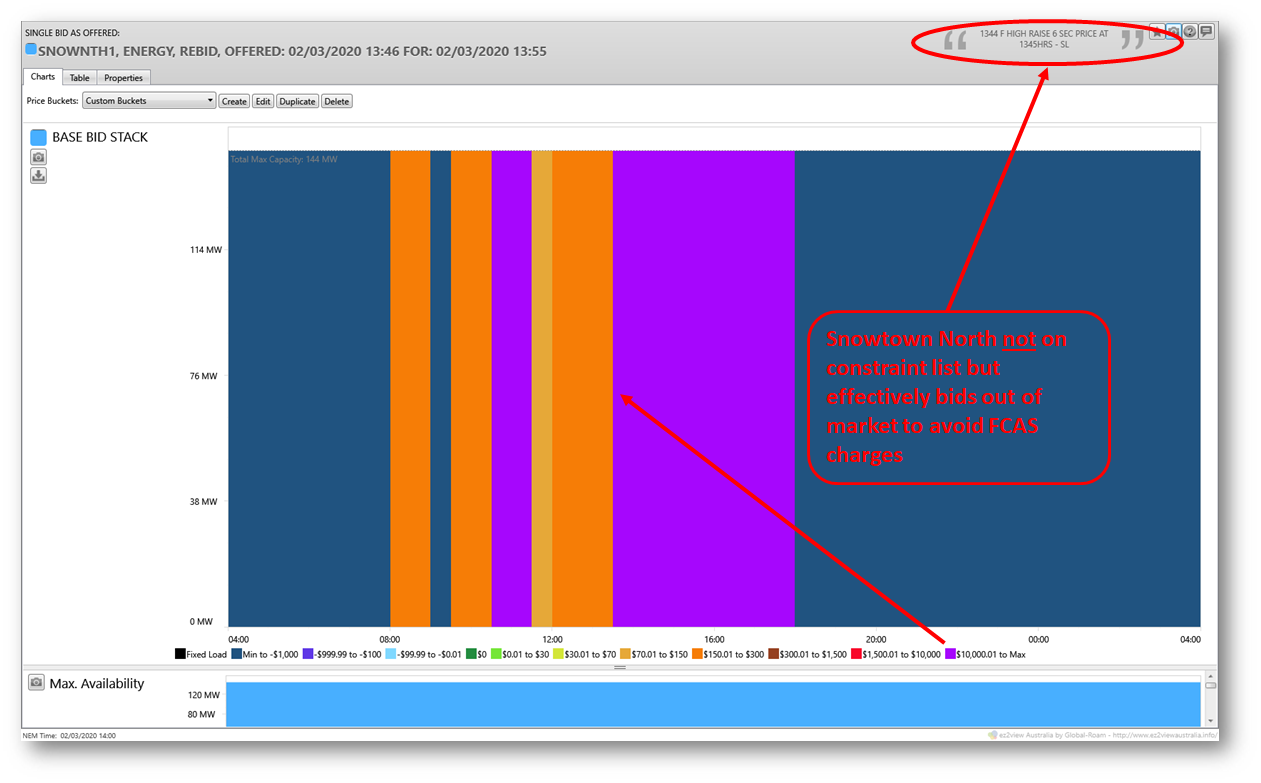
Looking at the bids and rebids of SA’s windfarms using ez2view’s extensive bid analysis functionality, we can see some of these farms re-offering all their volume at or close to the market price cap, in a direct response to their exposure to these FCAS costs:
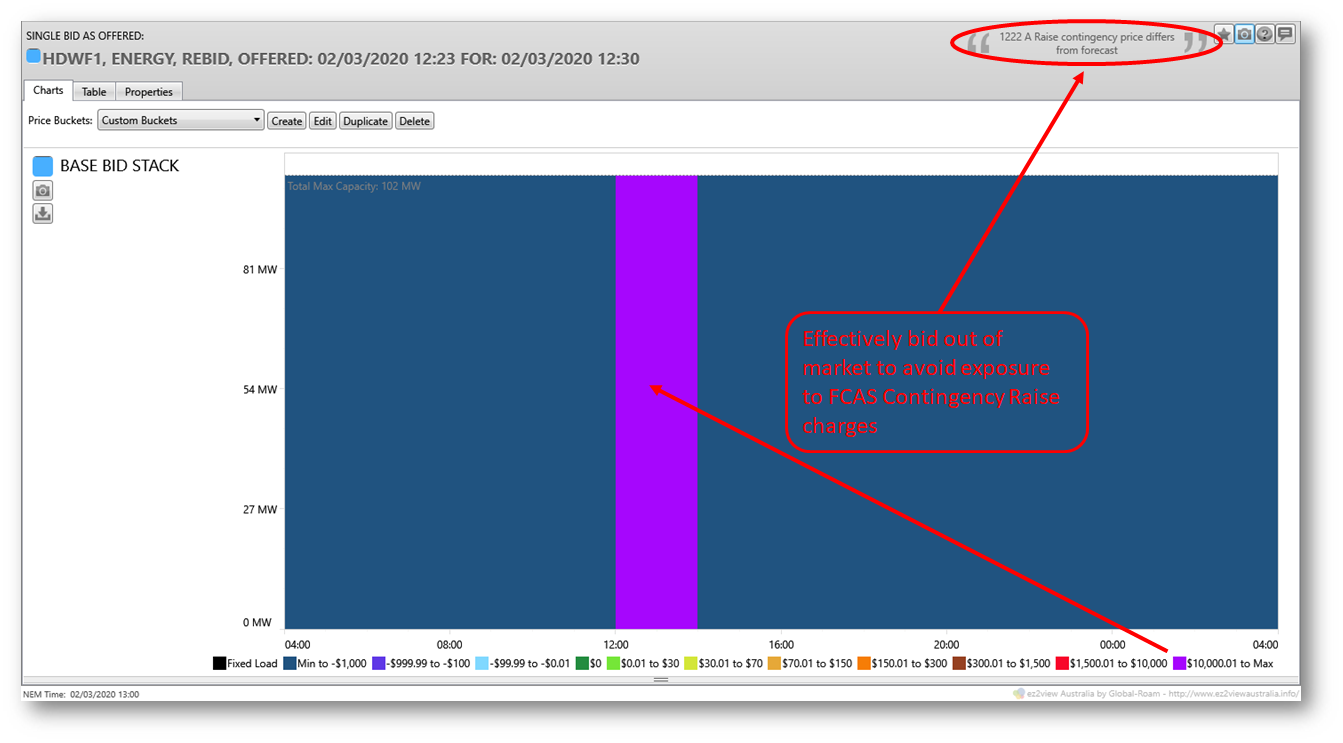
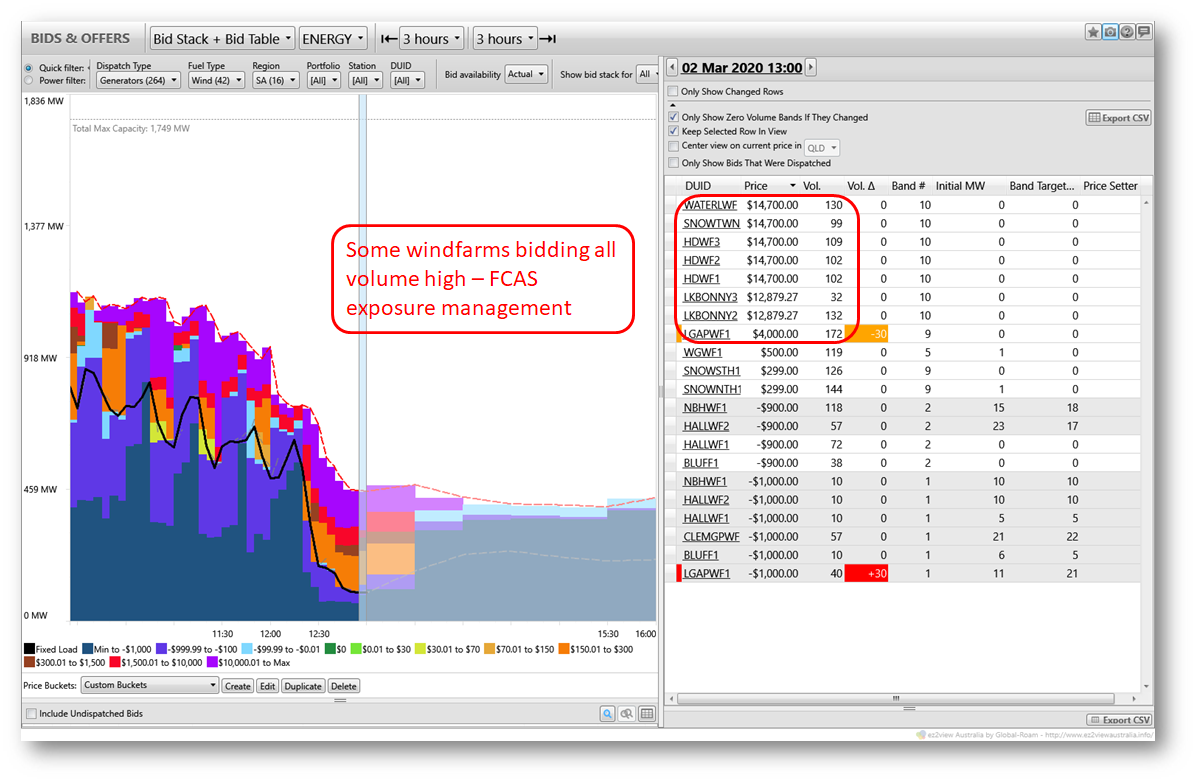 For confirmation of the driver for this rebidding, here’s a rebid from one of those farms made not long after the separation event:
The effect of rebidding high like this is that – unless the energy price actually goes to the market cap – the plant is effectively bid out of the market and gets zero dispatch – and hence zero exposure to those high FCAS prices. This behaviour is one reason for the clear reduction in windfarm (“semi-scheduled”) output in that earlier overview trend chart.
Managing Low Demand …
But that wasn’t the only factor driving down wind generation volumes – at 13:55 NEM time AEMO introduced constraints that aim to maximise certain forms of generation (by minimising other forms) during periods of low demand and little or no ability to export to the rest of the NEM. Here’s the key one:
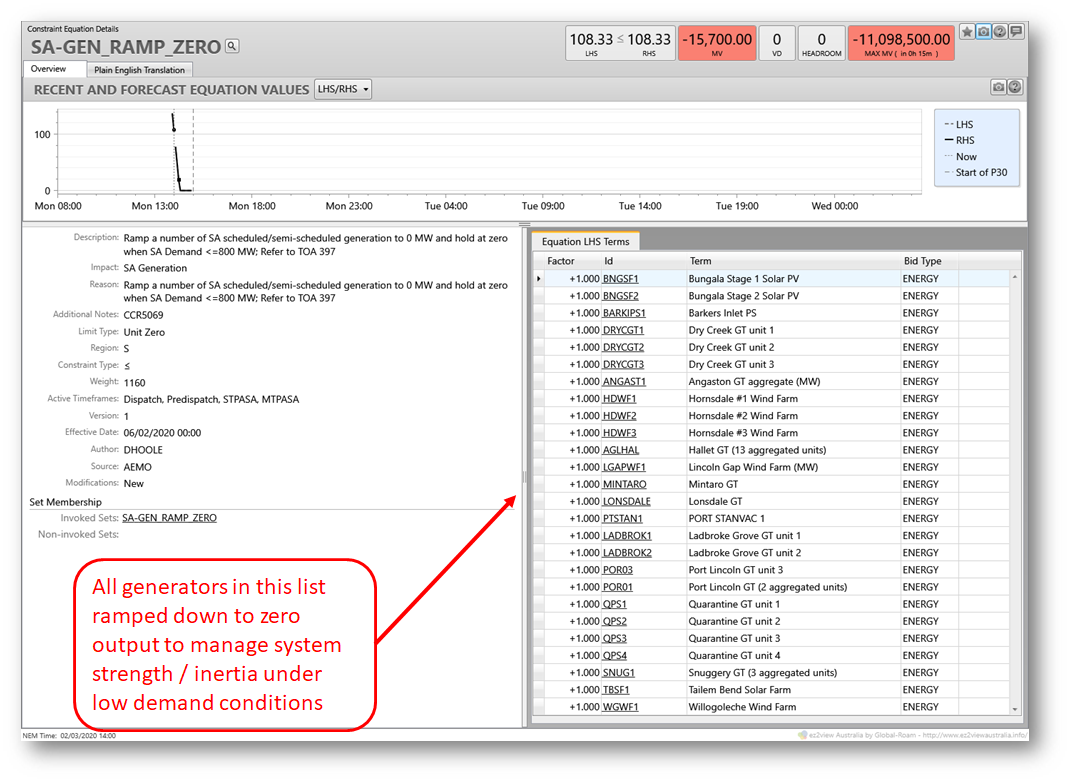 There’s a long list of SA generators in that constraint – not all wind and solar either – whose output basically gets forced down to zero for the duration, in order to leave maximum headroom for others. (Another constraint in the same set prevents imports on Murraylink, by the way).
… But leading to high prices
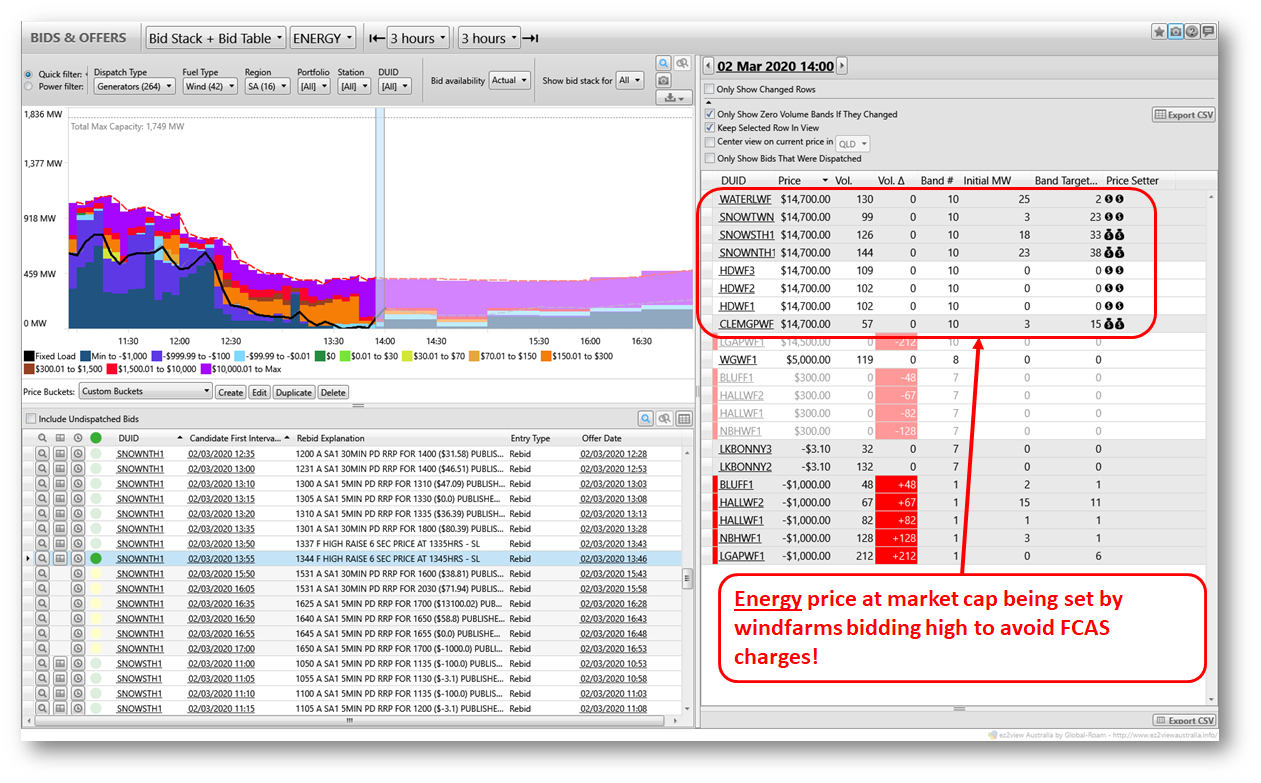
Coincidentally (in a temporal sense) with imposition of this constraint, energy prices in SA leapt to $14,700/MWh – the market price cap. Strange given the very low demand levels? Without time for a full analysis, I’m speculating that one key reason for this happening is that a number of wind generators not caught in the above constraint had also bid their volumes up to the market cap to avoid FCAS exposure – here’s one of them, Snowtown North:
 Looking at the bidstack for the next pricing interval, we see that Snowtown North still gets dispatched and is one of a number of windfarms actually setting the spot price at this extreme level:
 Whether that’s exactly what they intended, I’m not sure. But just like “Survivor”, life on an island can be fraught with challenges.
About our Guest Author
 |
Allan O’Neil has worked in Australia’s wholesale energy markets since their creation in the mid-1990’s, in trading, risk management, forecasting and analytical roles with major NEM electricity and gas retail and generation companies.
He is now an independent energy markets consultant, working with clients on projects across a spectrum of wholesale, retail, electricity and gas issues. You can view Allan’s LinkedIn profile here. Allan will be sporadically reviewing market events here on WattClarity Allan has also begun providing an on-site educational service covering how spot prices are set in the NEM, and other important aspects of the physical electricity market – further details here. |


Will the forthcoming synchronous condensers soften AEMO’s islanding risk reduction requirements for SA, or reduce the cost of FCAS when interconnectors are out of service?
If the network owns the sync-cons, how do they charge or bid the services, and do they compete on equal terms with gas/batteries ?
The Electranet network appears to be only 10% Australian owned, with the rest shared between China and Malaysia. 65% of Transgrid is owned by Canada/Kuwait/Abu Dhabi. All the investment in this equipment will be recouped through the Regulated Asset Base (Electranet’s 2018-23 RAB was $2.7b without the new gear).
Past assessments have criticised network ‘gold-plating’ where RAB growth has outstripped demand growth. Demand is still not growing, but transmission is, with investment planned / progressing in several NEM locations, with the blessing of renewable lobbyists.
There is not much incentive for networks to maximise the use of existing infrastructure. The AEMC proposal to have generators reserve network capacity is a positive, ad is their decision to maintain the MLF specific to each generator (rather than averaging the losses). Building transmission purely to connect intermittent generation can only reduce network utilisation. That’s less efficient, that’s more cost than necessary.
It seems to me that we have a government guaranteed return, on privately owned monopolies, paid by consumers without a choice.
The foreign ownership of monopoly networks is worth noting, because of (a) the lack of competition and (b) the guaranteed returns.
The National Electricity Objective seems to have been forgotten.
“Will the forthcoming synchronous condensers soften AEMO’s islanding risk reduction requirements for SA, or reduce the cost of FCAS when interconnectors are out of service?
“If the network owns the sync-cons, how do they charge or bid the services, and do they compete on equal terms with gas/batteries ?”
They’re good questions and I don’t know all the answers. The syncons won’t be supplying any FCAS and therefore not needing to bid into current markets, but will indirectly influence energy and FCAS costs by reducing the incidence and impact of constraints currently used to maintain system strength and/or inertia in SA – both under normal operation and when islanded. Allan.
Thanks Alan. I’m also wondering if there has been any assessment of rooftop solar’s impact on FCAS?
Is there any correlation between FCAS and time of day?