
Precise and reliable monitoring of emissions from power plants is a challenge that is grappled by many. I will hopefully describe as simply as possible the different methods and why reliance on a single method can be risky, not practical or too costly for the outcome desired.
I will use a simple analogy relating to cars which hopefully will highlight the issues.
KPI Definitions
Following are the key performance indicators for an emissions monitoring system.
Precision (P1) related to how repeatable and close the results of a method, measurements and calculations are to the actual emissions for all operations. This is related to measurement uncertainty and level of simplifying assumptions used within the method.
Reliability (R) relates to how tolerant a method is to instrument failure and the reliability of the instruments used.
Time detail (T) relates to how often the measurement of emissions is available. (Yearly, monthly, daily and real-time)
Plant detail (P2) relates to the depth that the information is available (Station, Unit, Subsystem, Component)
Cost (C) related to the cost of measurements and calculations that are used for the method.
Methods
There are many ways to monitor the emissions from a power plant as detailed below:
| Method | P1 | R | T | P2 | C | Use | “Car” Analogy |
| Generic Emissions | 2 | 10 | 1 | 1 | 1 | Very high level energy switching studies.
Typically used by the Australian Energy Market Operator (AEMO) |
xx.x l/100km for a petrol car xx.x l/100km for a diesel car xx.x l/100km for a hybrid car – with a formula for converting litres of fuel to emissions. |
| Curves for a particular plant | 3 | 10 | 1 | 2 | 2 | For comparison of different makes of a particular type of generator. | Using the manufacturers “Combined” xx.xl/100 km with a formula for converting litres of fuel to emissions. |
| Real-time curves for a particular plant | 4 | 8 | 10 | 3 | 4 | For comparison of different makes of a particular type of generator under different operating regimes and environments. | Using the manufacturers “Urban” and “Extra” xx.xl/100 km accumulated in real time reflecting actual usage of the car with a formula for converting litres of fuel to emissions. |
| Real-time actual emissions | 4 | 6 | 10 | 2 | 9 | Direct measurement of emissions. Very susceptible to instrument uncertainty and failure.
Not very accurate or robust due to the type of sensors used and the environment the sensors are being used in. |
Using exhaust flow and emissions sensors on exhaust to directly measure emissions. (Not actually used but explains the concept). |
| Real-time actual fuel consumption | 5 | 7 | 10 | 2 | 6 | Determination of the actual emissions over a short period (hours) based on fuel consumption.
Can identify when change occurs but no ability to identify where problems may be occurring. Susceptible to single measurement uncertainty and failure. |
xx.x litres consumed from trip computer in car with a formula for converting litres of fuel to emissions.
xx.x l/100km from trip computer in car with a formula for converting l/100km to kgCO2 /100km. |
| Fuel delivered less storage (Input/Output) | 6 | 8 | 3 | 1 | 3 | Determination of the actual emissions over a long period (months and years) based on fuel consumption and fuel quality.
No ability to identify where or when problems may be occurring. Typically used for National Greenhouse and Energy Reporting (NGERs). |
Log of km travelled and fuel consumption from bowser less fuel in the fuel tank with a formula for converting litres of fuel to emissions. |
| Component Analysis | 6 | 7 | 5 | 8 | 5 | For finding the contributions to emissions caused by individual components within a generation system. | Mechanic hooking up diagnostic equipment to determine where performance is deviated from new. |
| System boundary deviation from curves (Losses) |
7 | 8 | 5 | 4 | 4 | Using curves and then adjusting the emissions based on actual deviations in energy loss at the system boundary.
Reliance on accuracy of OEM curves and single measurement uncertainty and failure. |
Measuring actual energy losses from the car such as radiator, exhaust and brakes and adjusting the manufacturers combined l/100km to reflect actual energy losses with a formula for converting litres of fuel to emissions. |
| Real-time mass and energy balance | 9 | 9 | 10 | 10 | 6 | Data reconciliation and validation.
Identification of problems and opportunities to improve. Typically used for Energy Efficiency Opportunity (EEO). Multiple measurements checked against other measurements in the process. Much less uncertainty and less reliance on a single measurement. |
During the development of a new car, the prototypes will be extensively instrumented and analysis conducted on the results to ensure the car is performing according to design and to identify areas where improvement could be made. Validation of the data to ensure the instruments are providing the correct information is an important part of the analysis as design and business decisions will be based on the data generated. |
A summary of the KPI for each method is provided in Fig 1
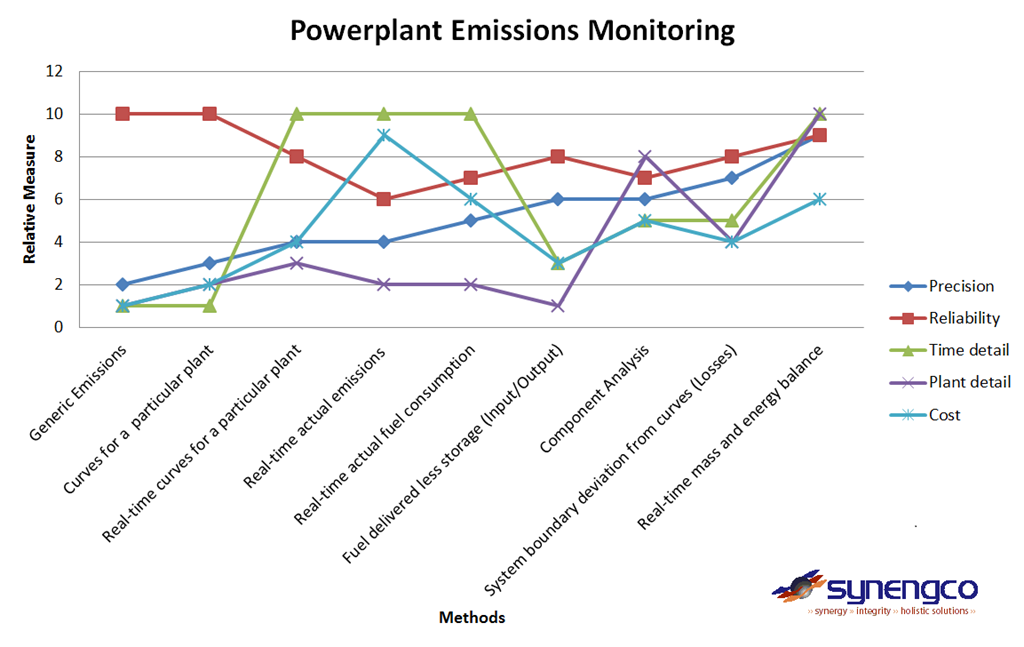
Fig 1 – Power plant emissions monitoring methods
Selecting a method
The method selected needs to reflect the importance of the desired KPI – with respect to the business outcome.
For example there is no point in investing in real-time monitoring and high plant detail, if the outcome desired is only an annual emissions figure for the national greenhouse gas inventory. On the other hand, if improved emissions was the target, then such a system would be near worthless.
In many cases there are multiple business outcomes desired from external compliance to internal process improvement. This leads to an unstructured use of multiple methods resulting in different results from each method.
The differing results are easily explained by the KPI for each method however less well understood by personnel within an organisation and the regulators of the industry. This becomes a source of confusion to many organisations due to the differing results.
If a structured use of multiple methods is used, the confusion disappears with the reliability and precision increased as detailed below.
Combining methods
Each method has a certain level of accuracy, reliability and complexity. The accuracy and reliability can be significantly enhanced by using multiple independent methods in a structured manner.
For example with your car the accuracy associated with real-time fuel consumption monitoring can be significantly improved if it reconciled with the log of km travelled and the fuel put into your car at the bowser.
If the two methods are used consistently then it provides a check and balance against each method and identifies instrument failure. Using two independent methods means you know there is a problem but it is difficult to identify which method is having the problem.
Using 3 or more methods means the accuracy is improved and it is possible to identify and quantify which method is failing.
Typically, at Synengco we use 3 to 4 methods and recently this has saved one of our customer significant expenses by identifying and quantifying a measurement error used to calculate fuel consumption and emissions generated. The benefit to our customer was in excess of $1 million.
About our Guest Author
 |
Don Sands is the founder and CEO of Synengco.
Synengco export technologies to Europe, USA, India and China and provide technology to technology providers like Siemens and Honeywell International. Synengco’s emission monitoring system (SentientMonitor) provides a framework and plug in solutions to include all the methods outlined above and is arguably the most comprehensive and auditable real-time emission monitoring system in the world for power generation.
Don has been instrumental in the development of SentientSystem® a leading technology to enable and optimise your process and technology innovations. Further background to Don can be found on Don’s LinkedIn profile. |

Thank you for this. Interesting and much appreciated. I’d point out for the benefit of other readers that
1. US EPA requires power stations monitor GHG emissions from the exhaust/stack at 15 minute intervals and sum hourly for reporting (from memory). The instruments are required to be automatically calibrated at frequent intervals too (either every 15 minutes or hourly or similar, from memory).
http://www.epa.gov/airmarkets/business/ecmps/docs/ECMPSEMRI2009Q2.pdf
http://www.epa.gov/airmarkt/emissions/docs/plain_english_guide_par75_final_rule.pdf
2. EirGrid calculates CO2 emissions at 15 minute intervals. The total emissions per year reported to the EU and IEA by other government departments based on total fuel consumption and properties reconcile closely with the EirGrid calculations. The calculation method is described here: http://www.eirgrid.com/operations/systemperformancedata/co2emissions/ :
“EirGrid, with the support of the Sustainable Energy Authority of Ireland, has together developed the following methodology for calculating CO2 emissions. The rate of carbon emissions is calculated in real time by using the generators MW output, the individual heat rate curves for each power station and the calorific values for each type of fuel used. The heat rate curves are used to determine the efficiency at which a generator burns fuel at any given time. The fuel calorific values are then used to calculate the rate of carbon emissions for the fuel being burned by the generator. ”
This paper is excellent and shows how to estimate emissions saved by wind generation for grids that have reasonably reliable emissions estimates at 15 minute intervals: http://www.sciencedirect.com/science/article/pii/S0301421513007829
Here is a (free) pre-submission version: http://docs.wind-watch.org/Wheatley-Ireland-CO2.pdf
3. As far as I am aware, neither AEMO nor CER have estimates that are even close to the time spacing (e.g. 15 minutes), precision and accuracy needed to make a reliable estimate of the emissions saved by intermittent generators such as wind and solar power. Therefore, we don’t know how much emissions are saved by wind and solar power in the NEM. Our best guess is that the effectiveness of wind power in the NEM would be roughly equivalent to wind power in EirGrid – i.e. about 53% effective at 17% energy penetration (proportion of electricity generated by wind power). That means 1 MWh of wind power avoids just 53% of the emissions from 1 MWh of electricity generated by EirGrid without wind power. This is important because it means the CO2 abatement cost with wind power is around twice what is normally claimed by the wind power proponents.
4. Of course, if we took a different approach to reducing GHG emissions, there’d be no need for rigorous, precise, accurate emissions monitoring to the standards needed for commerce in CO2. The compliance cost of emisisons monitoring will become huge if we go down this route. There is a better way. Just fix the problem. The USA and IAEA could do that by removing the impediments that are making nuclear power far more expensive than it could and should be. As the costs come down nuclear would replace fossil fuels world wide with no need for carbon taxes, binding international agreements, police forces to force compliance, international trade disputes and emission monitoring.