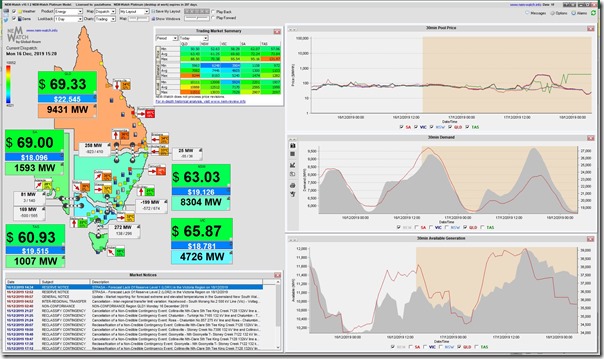
A quick note today (which might be updated later, time permitting) to include the following snapshot from NEMwatch v10 to note the Scheduled Demand up at 9,431MW in the 15:20 dispatch interval (still 600MW below the all-time maximum set just last summer):
————————————————————————-
PS – a few additional points, added a little later
————————————————————————-
1) Temperature turn-around
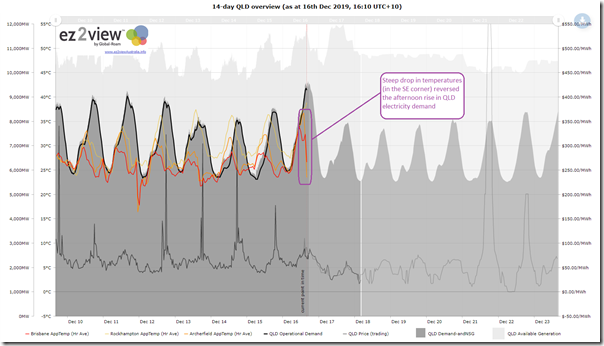
The following trend view from ez2view provides an illustration of quite a rapid decline in temperatures in the south-east corner through the afternoon (to the relief of many), which also reversed the course of what had been rapidly rising electricity demand in the Queensland region to that point:
As a result of this, the Scheduled Demand peaked at ‘only’ 9,434MW in the 15:25 dispatch interval (5 minutes after the snapshot shown above). Licensed users of ez2view can access their own copy of this live trend here.
2) An illustration of the challenges in demand forecasting
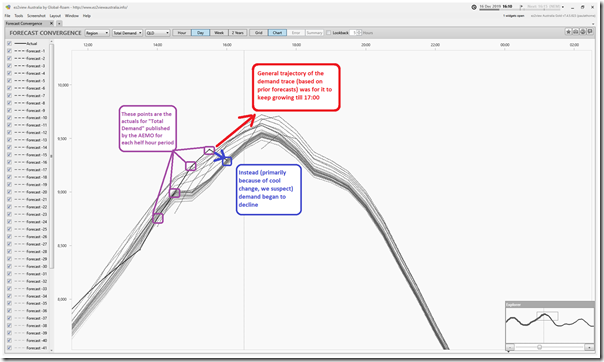
Noting (as previously noted here) that it’s important to think about these as ‘discrepancies’ or ‘deviations’ from demand forecast – rather than an ‘error’ – we use the ‘Forecast Convergence’ Widget in the installed ez2view software to highlight these two views of the turn-around in the demand trajectory:
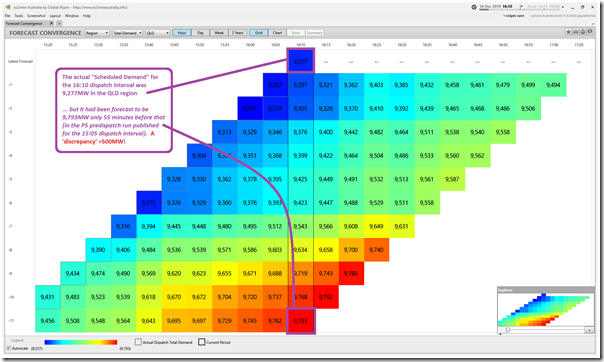
On a half-hourly basis, we see the demand declined (on this basis) between 16:00 and 16:30. A tabular view enables the user to read the actual numbers, so we flipped to this view (and also zoomed in to see results on a dispatch interval basis):
3) Demand rebounding as the sun (and solar PV injections) sets
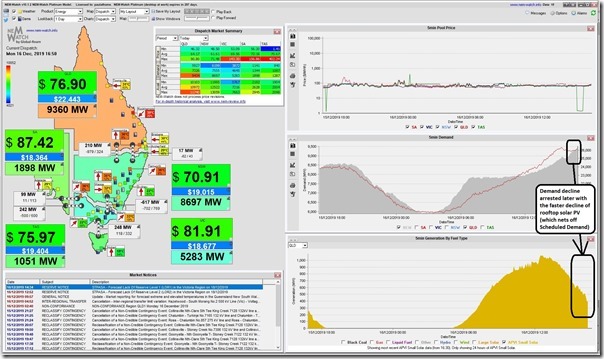
Also worth noting that it’s become fairly common to see this sort of rebound in demand a little later in the day, as shown in this snapshot from NEMwatch v10 at the 16:50 dispatch interval
This proceeds to provide a “two hump” peak in demand which we have begun to see fairly regularly through Queensland summers. Note that this NEMwatch v10 image shows APVI’s estimates for rooftop solar PV but (as explored here) it may be that the APVI estimates are significantly underdone – in which case the rate of decline in the late afternoon period would also be significantly underdone as well.
4) Sweating on the return of Loy Yang A2 in Victoria
Finally, we see a few Market Notices warning of Low Reserve Condition forecast for Victoria for Wednesday this week (18th December). The return of Loy Yang A2 can’t come soon enough!


Leave a comment