Eight days ago we noted (in this article) how the AEMO had been forecasting a Scheduled Demand down at the level of 352MW for Saturday afternoon, 26th October 2019 – and how it missed that level by about 200MW on the day.
There are several different reasons why the actual demand on the day was significantly higher than forecast (especially in percentage times) – that’s food for a different article as time permits.
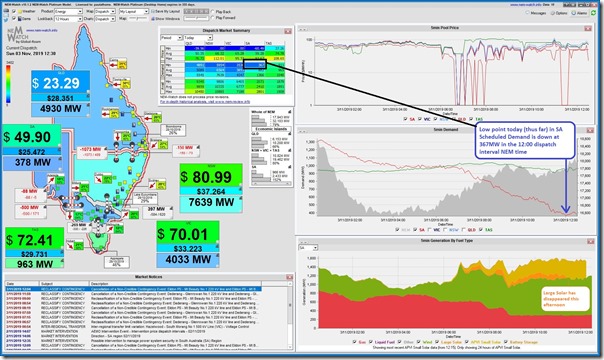
Today, however, we might go very close to that low level – at the time of writing, the lowest (so far) today was down at 367MW for the 12:00 dispatch interval – with the general conditions this afternoon captured in this snapshot a little later from NEMwatch v10:
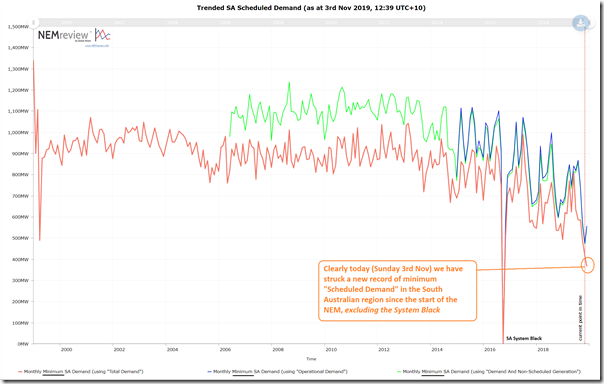
Updating the same trend in NEMreview v7 from a week ago, we see that clearly today’s demand level (even just at the 367MW level it’s dropped to so far today) is the lowest point seen in South Australia for “Scheduled Demand” since the start of the NEM, excluding the SA System Black event. :
See this earlier (and longer!) article for the gory details of the different ways that “demand” is measured in the NEM to understand what’s different between Scheduled Demand (the measure that has been used the longest) and Operational Demand (which AEMO is increasingly using, but has limited history).
In the trend above we can see that Operational Demand does not drop so significantly today!


Leave a comment