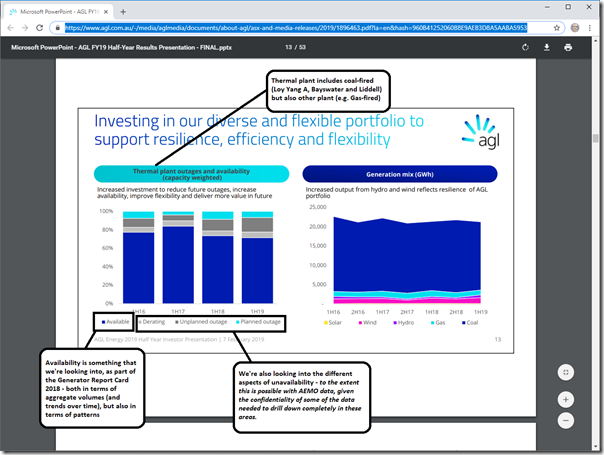
Yesterday (Thu 7th February), AGL Energy provided this 2019 Half-Year Results Presentation to investors via the ASX. Page 13 was one flagged to me as a result of several recent discussions:
We’re currently buried in the detailed analysis that’s central to the delivery of our Generator Report Card 2018 to the growing number of clients who have pre-ordered (at discounted price– thanks for that!) and those who will order when it’s completed in another month or two (at normal price).
As different aspects of availability (including trip rates, outage lengths and aggregate availability levels) are amongst the metrics we’re assessing in completing this analysis, I thought it worthwhile to have more of a look. Now the chart provided to investors was noted as including data for all thermal plant in their portfolio – so will include:
(a) coal units – being Loy Yang A (brown coal), Bayswater & Liddell (black coal)
(b) plus more.
Given other commitments today I only have time to look at the coal units on a station basis, though we will be looking at all units individually (across all power stations in the NEM, no matter what fuel type) as part of the Generator Report Card.
I can understand (it being a half-yearly report) that for investors AGL has chosen to highlight results for four discontinuous 1H periods – however from a technical perspective it seems better to trend data sequentially over time, and to extend trends back to the start of where data is available (which in the case of this data set is October 2001).
Noting that this data is preliminary data only, and has not yet been thoroughly checked, here’s what we can see at a quick glance:
(A) Availability patterns at Loy Yang A
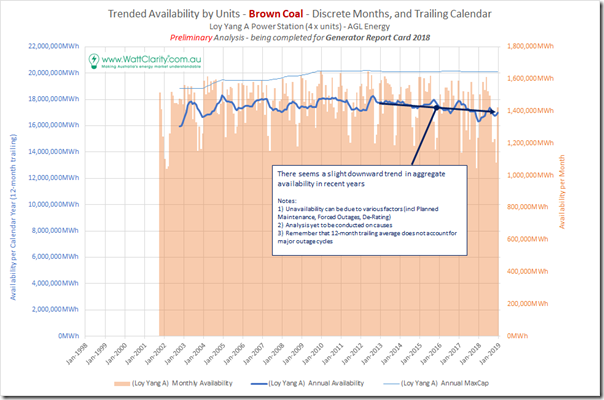
The following chart aggregates availability across the 4 units at the station – both discretely by month, and with a 12-month trailing average:
Also on the chart is the equivalent annual volume using Max Capacity at the station, noting the upgrades that have been completed in the past.
A few observations with respect to this chart:
1) We have not yet completed the process of delving into the various contributions to unavailability – which include planned maintenance, de-ratings and forced outages. This analysis is being completed
2) I’ve also added a reminder that a 12-month trailing average won’t fully take account of the cyclic nature of major outages on units, as these are carried out less frequently than annual (e.g. every 3 or 4 years) but have a large impact on availability figures for the month or two the outage spans.
3) With this in mind, we do see a slight downward trend in the average level of availability across the past 5 or 6 years.
(B) Availability patterns at Bayswater
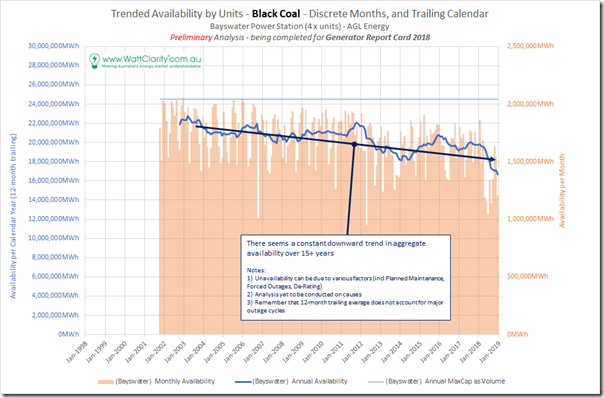
Here’s the same chart for Bayswater – which AGL acquired fully when it completed the acquisition of Macquarie Generation in September 2014:
The same notes apply for this as to Loy Yang A above – but we do see a more rapid decline in the average level of availability across the 4 units. Indeed, this appears to have been happening fairly consistently for 15+ years.
The reasons behind this will be one interesting aspect of our investigations for the Report Card to delve into.
(C) Availability patterns at Liddell
Now Liddell has been much in the media in recent years, and is spoken about as a possible motivation behind the current Federal Government’s “big stick” divestment legislation.
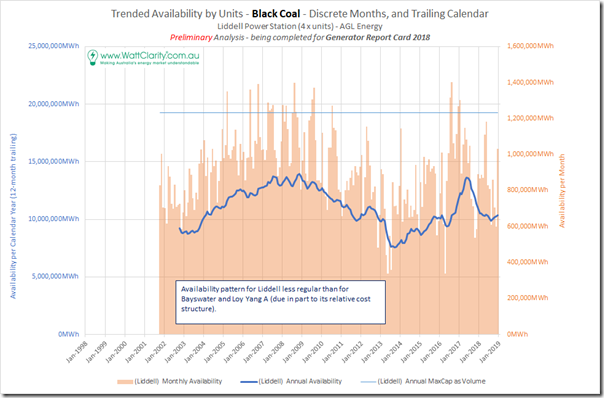
Hence I was particularly interested to pull this chart up for the ageing (and soon to close?) Liddell Power Station, which also came with the Macquarie Generation acquisition:
The first thing that jumps out at me here is the much lower level of availability across the years than either of the other two above.
There’s also an unmistakable cyclic nature in this Availability Factor:
(a) increasing to around 2009
(b) then declining to a low-point in 2013 in conjunction with a couple pretty poor months in that year,
(c) climbing again into 2017
(d) before the start of what appears to be another decline to around the level of approximately 50% (which may well continue into closure).
————–
…. now back to our Generator Report Card 2018, so we can get into more detail for these stations along with all the other ones across the NEM…


Appreciate the analysis Paul, and I’m looking forward to the generator report card. Many thanks – Jeremy
We are keen to deliver it to you, Jeremy. A load of data crunching, analysis and explanation to be done before we can do that, though!