It’s early afternoon on Monday 9th July as I write this, and already there’s been a number of interesting events occurring in relation to the South Australian region of the NEM.
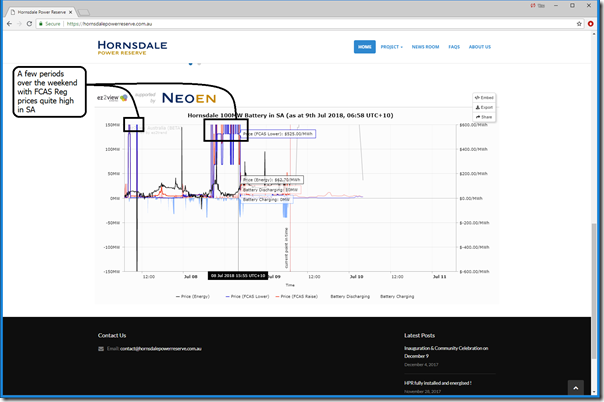
I arrived in the office this morning and checked one of our dashboard displays to see that FCAS regulation prices had been elevated over the weekend in South Australia, so posted this tweet to note that this had occurred (highlighting how interested observers could view the data themselves via the ez2view trend widget on the Hornsdale Power Reserve website, thanks to Neoen):
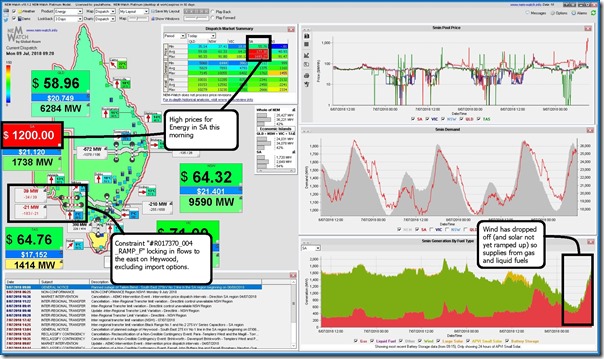
A little later on, my phone starts buzzing with SMS alerts (available in NEMwatch and ez2view) see that the energy price had started doing gyrations in the South Australian region, so tweeted this snapshot of the 09:20 dispatch interval from NEM-Watch v10:
I noted on this image two of the factors contributing to the morning price spikes:
Factor #1 = Low wind
We see that wind has dropped down close to zero in the South Australian region overnight – as a result of which thermal plant have had to pick up the slack.
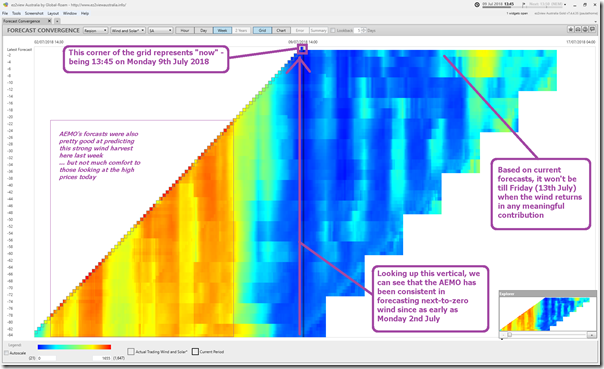
Incidentally we had noticed the forecast steep drop off in aggregate wind output occurring today as early as last week in discussions with other clients – so at least we can be grateful that the AEMO’s forecasts performed well in this instance, as seen through the ”Forecast Convergence” widget within ez2view snapshot from this afternoon here:
Another reminder that the challenges of navigating this energy transition are far from fully sorted through…
Factor #2 = Import restrictions
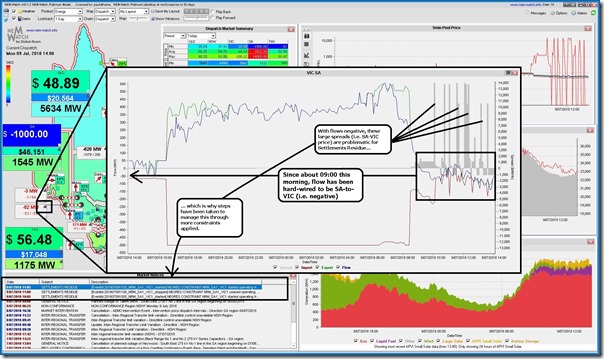
The low wind conditions are coupled by the fact that the the flow from Victoria over the Heywood link has not been possible since about 09:00 this morning. In the snapshot from NEM-Watch above at 09:20 I noted the constraint equation that was active at the time – though there have been several having an effect. The end result is that flow has been hardwired to flow east, which is the opposite of what we could expect to see at times of low wind in South Australia – as shown in this follow up snapshot from NEM-Watch at 14:00 this afternoon:
With competition disappearing in the South Australian region from two large sources (wind, and imports) it’s no wonder that prices have spiked…
We also note that, through the day, the AEMO has had to take steps to manage the accumulation of negative settlements residue as a result of constraining Heywood to flow east.
.
.
We’d been focused on other client commitments this morning so had been happy to just leave dashboard for SA running in the background whilst working on commitments from last week – however the phone kept buzzing (with SMS, and then the questions started coming in) so we looked a bit further to quickly explore a number of other contributing factors.
Factor #3 = Low solar
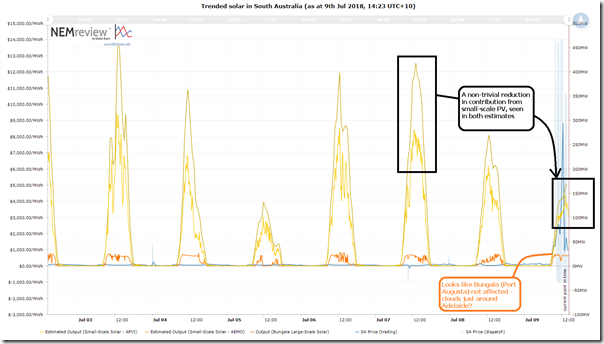
I saw that others had commented that solar in South Australia had also been suffering today as a result of cloud cover – hence had a quick look with this trended output of solar for both:
- aggregate small-scale solar across South Australia (both AEMO and APVI estimates, noting earlier comments about the challenges of opacity of small-scale solar PV); and
- what we can see of output of Bungala Solar Farm in Port Augusta, first large-scale project to hit the boards in South Australia.
This trend is produced in NEMreview v7, and clients are able to access the template here as a starting point for their own queries:
We see an effect in the order of several hundred megawatt (a little uncertain, because of the estimates), but this is not the most significant factor.
Factor #4 = Gas prices
As noted before, gas prices have a direct input on the price of electricity – especially in South Australia following the closure of Northern in May 2016.
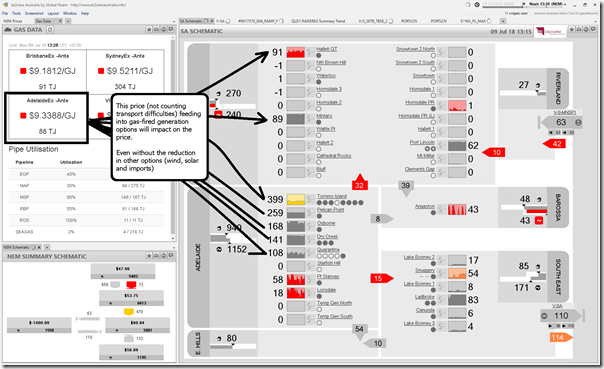
Here’s another snapshot from another screen from ez2view this afternoon, highlighting today’s price at the Adelaide hub of the STTM (at $9.34/GJ) and the way in which this will be affecting most of the generation options with capacity to supply into the South Australian region today (given low wind, challenged solar and restrictions on imports):
If there was more time we’d do more analysis here.
Factor #5 = issues at Pelican Point
In the “SA Schematic” widget included in the ez2view snapshot above we see that the Pelican Point power station had only been running at part-load through the time horizon shown in the trended capacity factor charts in the schematic. One of the questions I’d been posed from one of our callers was about why this was the case.
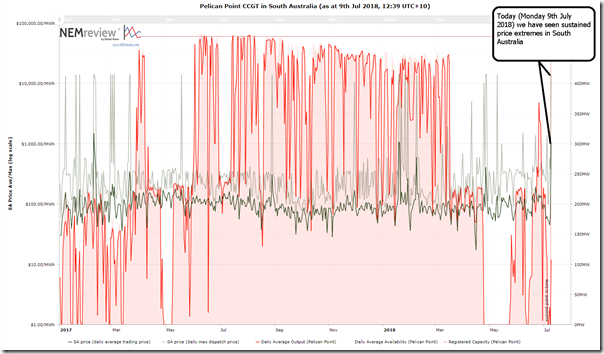
This afternoon I’ve produced this 18-month trend of Pelican Point from NEMreview v7, which highlights how:
- the station has not run at full since March, and
- through May has had several weeks on outage
- which it seems to have (partly) returned from.
NEMreview clients can access my template here as a starting point for their own analysis.
I’ve quickly scanned bid and rebid reasons since over the past month or so to form the impression that the reasons suggest that return to service hasn’t been as smooth as Engie (or the market more generally) would like – but there’s insufficient time to drill into the detail at this point…
Factor #6 = questions about AGL at Torrens?
Naturally, there are others asking questions about AGL at Torrens Island. I saw in the SA schematic above that they had 7 of 8 units running, but still less than 50% capacity factor across A and B station. No more time to look today, sorry.
Offsetting Factor = Demand Response!
As noted before, we have large energy users as clients in all 5 regions, representing sizeable loads (many 100MW’s). A number of our clients have loads that perform a variety of demand response services – which we know, in South Australia, would have been activated today. One of the jobs I have to get back to is to take a deeper look at some numbers to help one of them with some particular demand response optimisation challenges, hence the volatility is quite timely reminder…
.
.
If time permits in future, we might return to this in the coming days to have a closer look….


With gas prices at $9.34/GJ the fuel cost for gas generators alone will be $9.34/GJ * 3.6MWh/GJ @ 30% efficiency = $112/MWh. Which makes it even more interesting as to why TIPS would be running 7/8 units at less than 35% CF as shown in the figure at that price. But the real issue is the interconnector outage – it would be much harder to get these outcomes without it.
The interconnector is no issue. There was always available capacity all day, physically at least.
(Only one of the two circuits was out for maintenance).
Available capacity is not indicative of market outcomes. And the interconnector was limited to less than 100 MW throughout the day (currently limited to 37 MW).
TIPS would be running units at part load so they can quickly ramp up and meet AGL’s own peak demand in the evening. They are probably not running at higher loads during the day because they are long on capacity during the day and want to retain line pack in the pipeline to meet the peaks. Just because the pool price and gas price is high doesn’t mean that this reflects a gentainers real position.
But if they could sell more power at close to max wholesale price now, and potentially fall short of their retail demand later (assuming interconnector/wind issues ease by then and prices are more typical), wouldn’t that still present a good arbitrage opportunity?
Maybe they didn’t want to assume the interconnector/wind issues would be overcome by the evening peak? AGL are probably a bit cautious following the issues in NSW a few weeks ago when they were very short on capacity due to multiple unit outages.