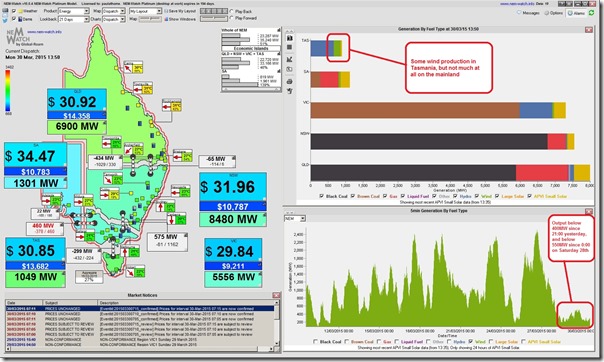
This morning I noted (and tweeted) that there was virtually no wind production collectively coming from all wind farms across the mainland.
This situation has continued through till this afternoon, which means that for the past 15 hours total wind production NEM-wide has been below 400MW, and as low as 200MW (with most of what is being produced in this spell coming from Tasmania). What’s more, the total wind production has been below approx 550MW since midnight heading into Saturday morning.
This can be seen in the following snapshot from NEM-Watch v10, highlighting how the current lull (approaching 62 hours) is longer than patterns seen over the prior 21 days:
Note that I have not had time to do any definitive review of the longest period at which wind output has been low (such a review would turn up different durations for different definitions of “low”). For the purpose of these back-of-the-envelope calculations, this is a useful starting point.
I’ve posted previously about the highs and the lows of wind production (including recently in terms of interaction with solar, given the inclusion of solar PV (small and large) in the new NEM-Watch v10) but today I have wondered what this means in energy terms – and the implications for storage.
Let’s assume, for the moment, that it’s only wind that supplies the NEM – a very extreme case that not a single person is advocating (on the left, or the right), but which I have found useful as an exercise to get my head around the size of the storage challenge.
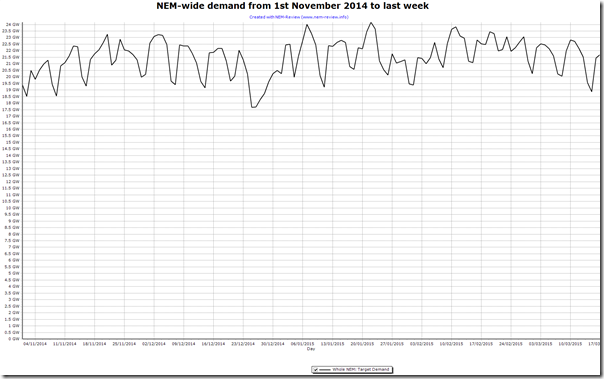
Since 1st November 2014, the daily average NEM-wide Scheduled Demand has oscillated from a low of about 17,700MW (on Christmas day) to a high of 24,100MW (on 22nd January – the day after I posted this) – as shown in this trend from NEM-Review:
Let’s pick 21,000MW as a rough median level, and knock off 500MW in a contrived scenario saying that the current doldrums would occur at a time when demand averaged this level – this means, in energy terms:
20,500MW x 62 hours = 1,271,000MWh of energy required from storage
Note that this assumes all sorts of things, like no alternate sources of anything except for existing wind capacity (whereas we can see in the NEM-Watch snapshot above the effect of hydro, for instance, as another zero-emission source – and one with more flexibility). However it does also assume that the current level of solar injections would persist at the same time, as they are captured (as negative demand) in the scheduled demand numbers in the NEM-Review chart.
The information in this article seems to imply (if my maths is correct) that a vehicle could contribute around 20kWh of storage – and this seems to be in the range of what I have read elsewhere. Leaving aside trickier technical questions (like how quickly injections can ramp up, and how controllable, how they’d be charged in the first place, how many cars could be left in-situ for 2.5 days without use to enable them to feed to the grid, etc…) this means that, if we were to deliver that amount of stored energy from electric vehicle batteries alone, we would need:
1,271,000,000kWh / 20kWh = 63,550,000 electric vehicle batteries required.
How many cars are there in Australia, I wonder? The ABS here notes something like 17,000,000 vehicles in total, or only 26% of the total vehicle number required in this contrived scenario (notwithstanding a smaller number of passenger vehicles, and some not being in the NEM, etc…).
Obviously this does not add up. Now, this scenario is contrived in a number of ways – so I wonder what might make it more “real”?
Continuing from this back-of-the-envelope calculation, we hypothesise that the NEM might be able to absorb about 10 times the current installed capacity of wind – and that this might mean that, at peak wind production, wind farms might supply all the NEM’s consumption at some points in time. Assuming a 10-times multiplier, this might also mean the 500MW minimum output above scales to 5000MW, which might mean 16,000MW “unserved” over the 62 hour period.
16,000MW x 62 hours = 992,000MWh of energy required from storage
992,000MWh / 20kWh = 49,000,000 electric vehicle batteries (still nowhere near plausible).
I’ll return to this thought process as time permits…
Please refer again to our FULL DISCLOSURE 1 about how we strive to remain technology agnostic.
Our role is just to make the complexity in the energy market more understandable – whatever its rules of operation just happen to be. We hope that, by doing this, negative unintended consequences of policy choices that governments choose to make on behalf of their constituents can be reduced.


Clearly an extreme case – but it does raise serious questions about the realty of relying on electric vehicle battery storage for NEM backup. It also brings into question some of these “100% renewable energy” analyses that have circulated over the last few years.
Thanks Martin
As a scenario assuming onlywind supply, with EV battery backup, it’s clearly not a plausible scenario.
I’m not sure that it makes sense to leap to it brings into question some of these “100% renewable energy” analyses as I’d believe that those studies would have included more than just those 2 technologies.
Clearly there needs to be more than just those two – and a number of people have suggested others to me – online and offline (such as Peter in his comment on this copy of the article on Climate Spectator.
This kind of analysis I’m doing as time permits, but next steps might include:
Step 1) Overlaying solar over the same period and scaling to see how the “unmet demand” gap might reduce (this is perhaps the most obvious next step as solar, along with wind, are the two renewable technologies being deployed at scale in the NEM already);
Step 2) Following this, I could look into how existing hydro capacity might be able to alter its operation (in this hypothetical scenario) to fill the gaps. Keeping in mind that most of this is not pumped-storage, but does have existing storage, it would seem to be a less expensive form of storage than anything new.
Step 3) Looking into other technologies that others are working to try to bring to commerciality to see how it would work to fill in gaps.
I suspect, at the end of the day, that a Pareto principle will apply here as well – in that the cost per greenhouse abatement will escalate quickly as we move up the “% Renewable” scale. Hence absolutely “100% Renewable”, under all scenarios (e.g. even in drought years), might not ever be an economically desirable outcome for the majority – unless some new technology comes along.
Paul
1271 GWh. That’s a lot of batteries certainly but it’s very doable by other means such as hydro. Whilst they are not pumped storage as such, we’ve already got *individual* hydro schemes storing far more than that so it can certainly be done.
Just as we won’t likely see all energy into the grid coming from wind, so too we won’t likely see all storage in the form of batteries.
As mentioned, no-one is expecting to go 100% wind, and I doubt many people think we can go 100% wind + solar.
The UNSW 100% renewable study indicated that solar and wind can meet about 88% of our electricity needs on an hourly basis throughout the year. The remaining 12% was obtained almost equally from gas turbines and existing hydro. The study required about 200 GWh of storage, primarily from molten salt associated with CST, though I suspect this is more likely to come from battery storage (and with the CST replaced with PV). Not insignificant, but achievable (10 million homes x 20 kWh, though I suspect a 3-way split between residential, business and distribution is more likely and sensible)
http://www.ies.unsw.edu.au/about-us/news-activities/2013/04/least-cost-100-renewable-electricity
Do you really think people want power companies putting extra cycles on their expensive EV/hybrid batteries?
I think David Osmond has covered much of the territory.
But. Remeber that we are only at the beginning of the energy innovation revolution. It was just a few months ago that Elon Musk announced his Powerwall, and although there are none in Australia yet we are already counting the impact that this new technology will have. Similarly PVT’s are on in their infancy, and practical affordable backup power generation has not yet emerged. I am championing the Liquid Piston 70cc rotary engine out of Connecticut as being the disruptive technology that will fill this gap for residential and small business. This engine fueled by natural gas (methane) will produce a maximum 3.5 kilowatts, but is ideally suited for a steady 2.5 kilowatt output. So for low solar periods this engine will bridge the electrical energy gap feeding DC energy directly into the Powerwall and its consequent waste heat at 5 kilowatts directly into water heating filling in for the thermal output from the PVT’s. Where energy can be used in this balanced way the Liquid Piston engine is operating with 80% and above efficiency from methane gas. My estimation is that such backup will be used up to 600 hours per year in the average residential or small business premises.
The question naturally arises, “where does the methane come from if we are to have a 100% decarbonised economy?”. Good question. as it turns out, according to Victorian government figures, each Victorian disposes of 2 tonnes of waste material per year, more than 50% of which is waste paper and cardboard ie cellulosic material that comes from trees. This amount of material, if gassified and recombined into methane gas produces enough gas to generate 15,000 kwhrs per year per household of 4 people. One can derate that figure in as many ways as one likes and it still provides the complete answer to the low solar period problem, and from a renewable sustainable source.
It is my expectation that by 2030 rooftop solar will be predominately 4.5/9.0 kilowatt PVT’s Powerwall and Liquid Piston engine backed up to the extent that there will be sufficient over capacity to smooth out all but catastrophic climate events. There is one other variable that is yet to come into play, and that is the EV, or from my expectation the plug in hybrid PHEV. Such vehicles fit well into the 4.5/9.0 PVT household as such a system has the capacity to charge 2 such 8.5kwhr batteried vehicles 365 days a year. How ever in the event of a major low solar energy period there will be the option to not charge the vehicles and run on their fossil fuel or even their more sustainable bio diesel fuel.
The short and the long answer really is that zero wind for a number of days is a problem for now, but not in the long term. Perhaps the real issue is how will industry, high rise residential, and high rise commercial resolve their energy problems?