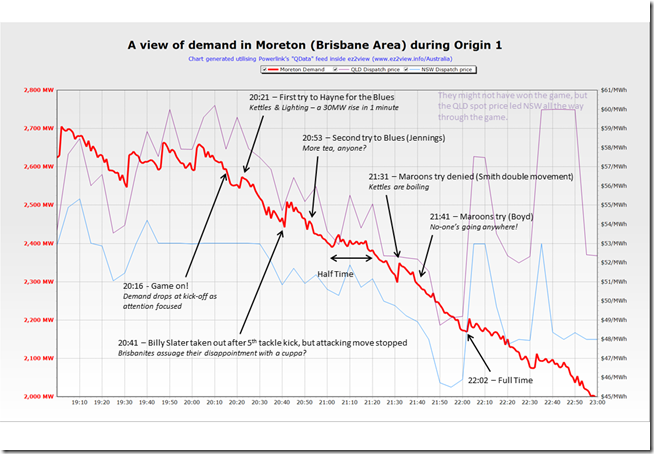
It’s not quite the massive 3,000MW jump in demand that National Grid has to deal with in operating the market in Great Britain as discussed here, but people in Brisbane exhibited their own form of group behaviour last night when watching the first of three State of Origin games.
The following chart has been generated to trend the 1-minute demand snapshots for the “Moreton” zone (encompassing demand in the city of Brisbane) from the Powerlink Qdata series, as delivered through our ez2view software package:
We’ve tried (as best we could, without losing a whole day in the process) to map onto the chart the key events in the game that might have linked to the observed changes in demand.
If you have an alternate interpretation of events (as they relate to electricity consumption), please do post your comments below.


Guys,
I think it was the Germans who used to monitor short term changes in sewerage flows at night and related that to TV audiences and commercial breaks – do you want to co-ordinate with the appropriate authorities in NSW and Qld to investigate the correlation?
I am more inclined to relate these demand increases to the domestic controlled load by the distributor. As 21:30 & 22:00 are common T33 switch ON times.
Thanks for the great alternative interpretation, Paul
Under that paradigm, what do you think could explain the more rapid declines in demand just before those two small jumps?
Will be curious to watch more tonight to see what happens …. (ok, will be watching the game, not so much the market)!
Paul
Not sure on the declines before the rises, but there is a decreasing trend in demand as the evening progresses most nights but it not linear. But back to sport and the NEM.. If you are looking for a sporting event that impacts the NEM then the winner in my mind is the Melbourne Cup the race that stops the nation. Demand decreases in QLD as manufacturing shuts down, office PCs go to standby etc… which is not offset by the thousands of TVs being switched on during the day.