
As noted on the overview for summer 2006-2007, there was a temperature-driven spike in demand in South Australia on Friday 8th December 2006.
However, demand also spiked on other days in the week, and on those occasions did not lead to the price spikes seen on the Friday. As can be seen in the following image, the spike lasted for several hours (2 hours with prices above $1000/MWh consecutively, plus many hours with prices above $200/MWh:
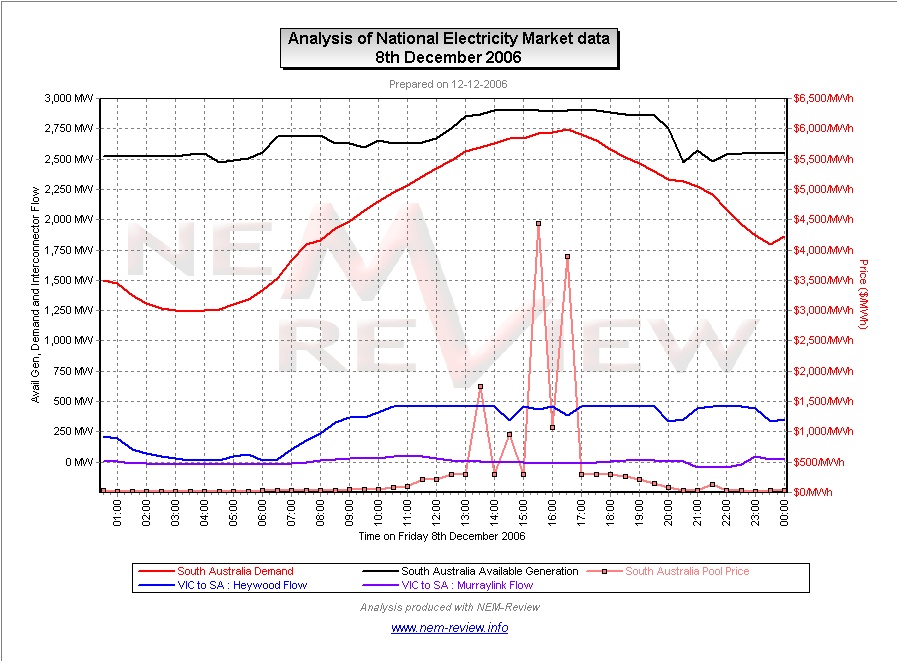
On the chart is shown:
1) Demand and Avaailable Generation capacity for South Australia during the day (showing clearly how the demand grows to within 160MW of aggregate available capacity at the time of peak demand).
2) Transmission flows on Heywood and Murraylink are also shown on the chart:
(a) Heywood is shown to be importing power into South Australia at maximum capability for much of the day.
(b) Murraylink is shown to be providing little transfer in either direction (and even a minor export into Victoria at the time of peak demand in SA).
For a closer look at what was happening across the NEM during the afternoon, we have included a snapshot taken with NEM-Watch of the action in the market
Please click on the image for a better view
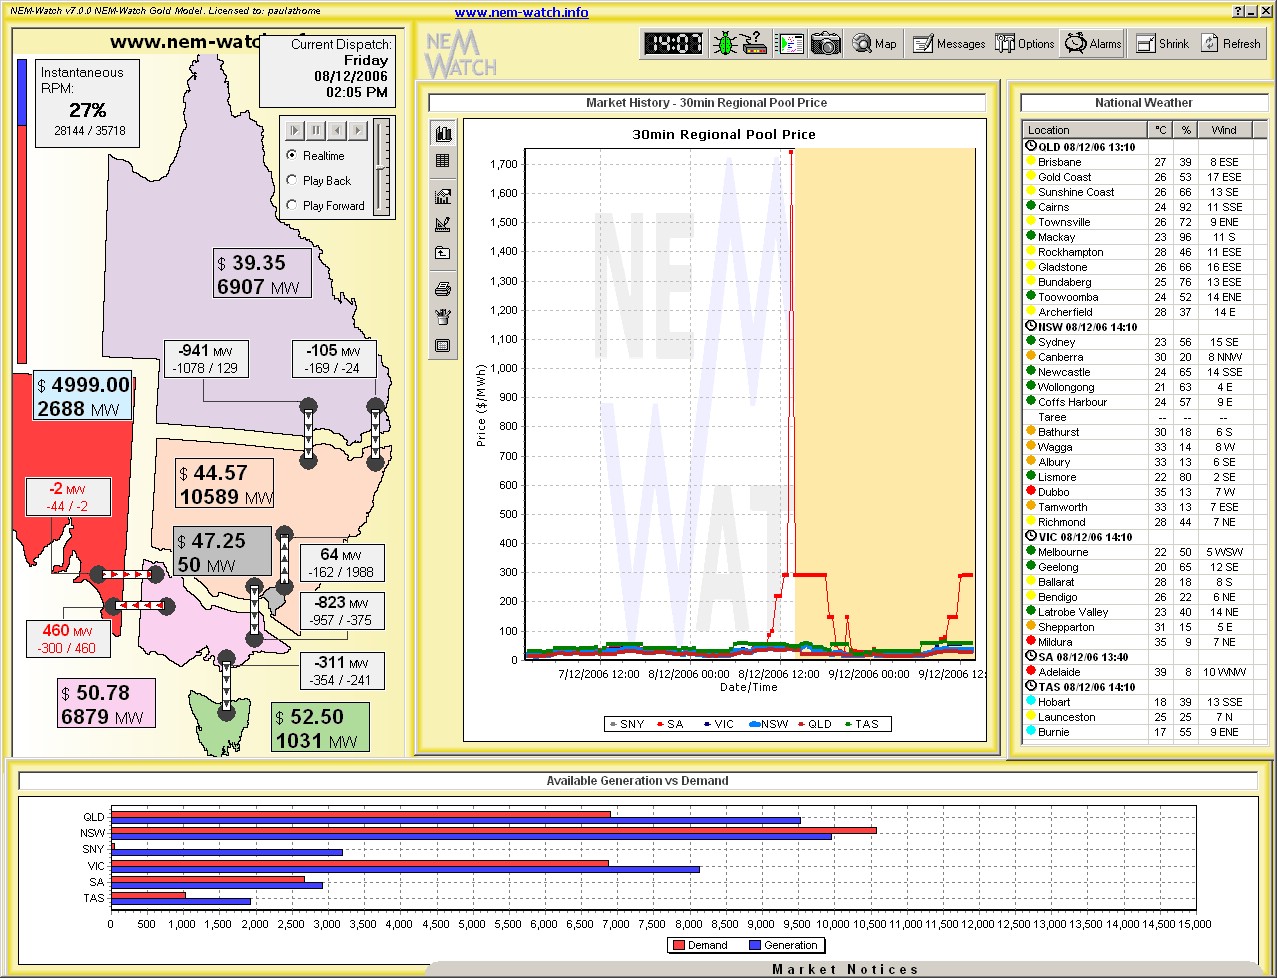
(This image has been taken from an early version of NEM-Watch 7 which we have been running for testing purposes)
On this NEM-Watch snapshot, you can see:
1) Temperatures of 39 degrees in Adelaide, and starting to rise in Western Victoria as well;
2) Transmission flows constrained on Heywood (into SA) and Murraylink (out of SA);
3) By virtue of the transmission constraints in effect, generators in South Australia had market power for this period, and set a price ($4999/MWh at 14:05) that was separated from the more moderate prices in the rest of the NEM.
4) Note also that NEMMCO’s predispatch was showing forecasts of higher prices on the Saturday as well (around $300/MWh), which did indeed eventuate (though not to the same extremes as prices on Friday).
At the dispatch interval shown above, it is seen that the Heywood flow was constrained, allowing prices to separate. Further investigation in NEM-Watch reveals the following chart summarising flows on Heywood over that afternoon:

Hence, it can be seen that the Heywood interconnector was constrained for much of the afternoon (with the few exceptions probably being instances where generation companies were adjusting their bids to try to maximise the benefits of the prices apparent earlier in the trading intervals in question.
Given that South Australian generators had market power for a couple of hours over the afternoon, it is useful to look at Generator behaviour (by trading company) on the day to see how each company responded to the local tightness of capacity in South Australia.
The following charts illustrate the behaviour of each participant over the day:
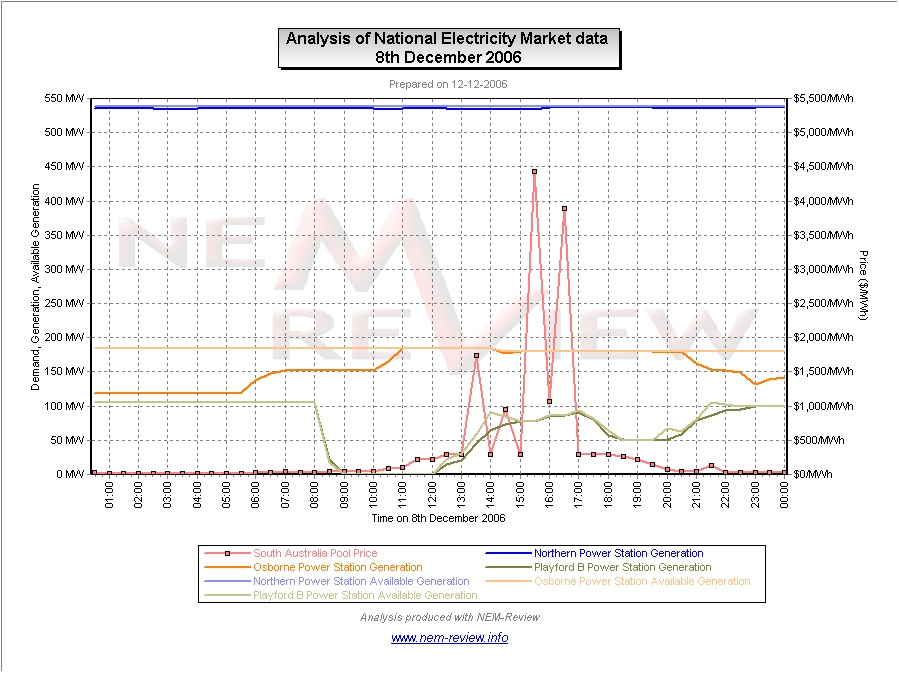
| Flinders Power |
This charts shows that Flinders Power was producing everything it could over the period of the spike in price.
1) The large base-load coal plant at Northern was running continuously at maximum capability through the day; 2) Output at the Osborne plant (which Flinders Power trades into the market by virtue of the Power Purchase Agreement with the owners of the plant) increased its output to maximum capability as the price climbed. 3) It appears that the smaller Playford coal-fired plant had come off-line for the weekend early, but was brought back on-line in order to ensure sufficient supplies in South Australia. It was running near maximum capability through the period of the price spike. |
|
|
|
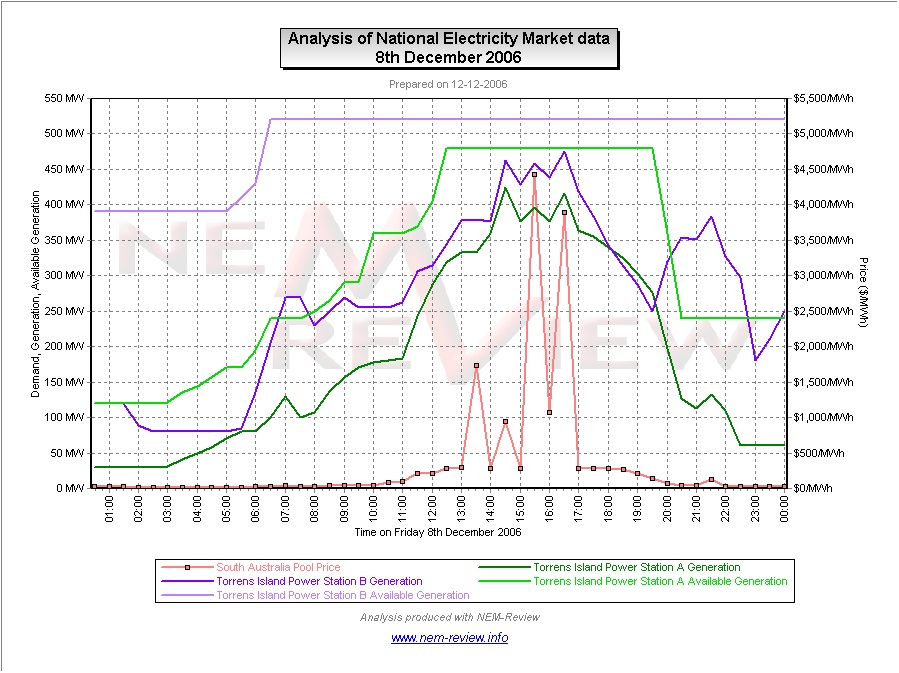
| TRUenergy |
This charts shows that TRUenergy was playing some roll in setting in the price over the afternoon, given that:
1) The output of both Torrens stations continued to vary throughout the afternoon (and generally increased with each jump in prices); 2) It is also seen that the Torrens plants were producing below their declared capability, with TRUenergy having 150MW or more of capacity “up its sleeves” during the afternoon. |
|
|
|
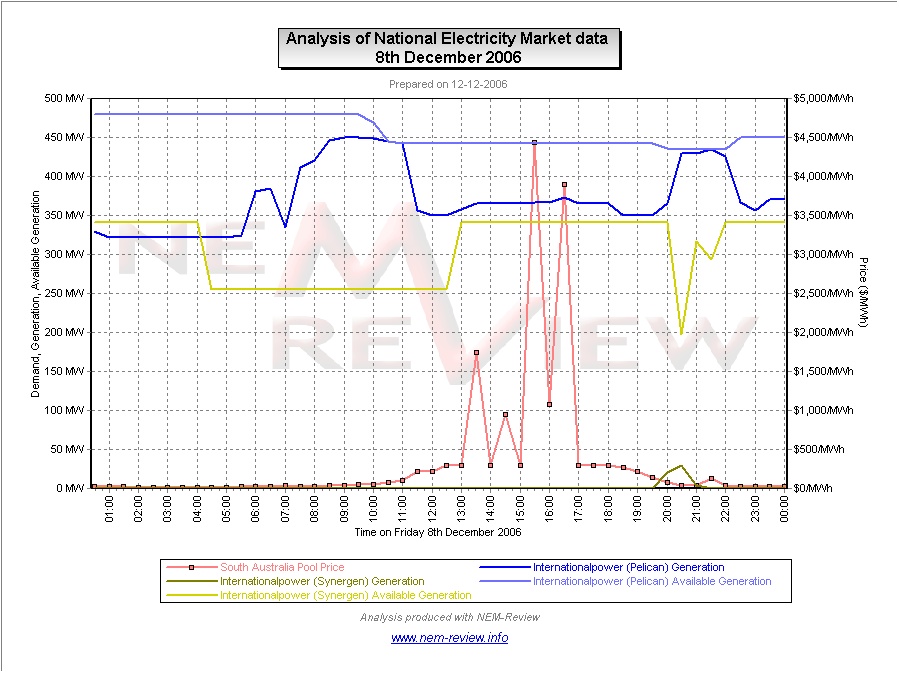
| Internationalpower |
Similarly it appears from this chart that Internationalpower was also playing a role in setting prices for the afternoon.
1) The large Pelican Point combined cycle plant reduced output in the morning, and maintained its output at 80MW or so below its declared availability for the afternoon (returning to full capacity again for 2-3 hours only later that evening); 2) A small amount of production at the set of peakers in the Synergen portfolio were only dispatched at 8pm that evening (though most of the plants were declared available to the market throughout the day). |
|
|
|
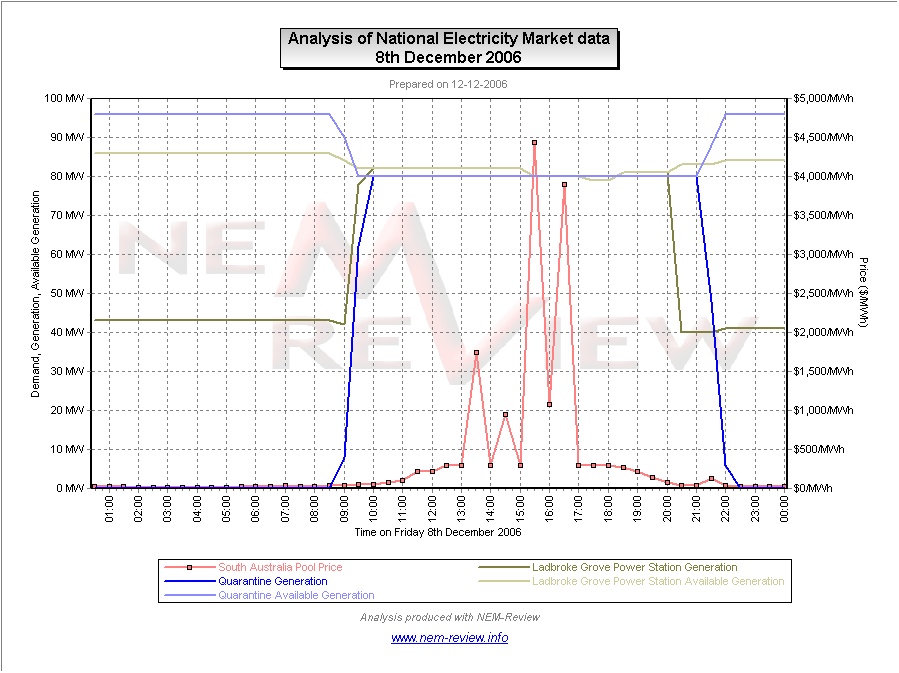
| Origin Energy |
This charts shows that Origin Energy was maximising its production during the afternoon.
1) The Quarantine open-cycle plant (which had reduced its capability in the morning) was online for 9:00 and was at maximum load by 10:00, when the price had only reached $49/MWh; 2) Similarly, the Ladbroke Grove plant doubled its output from its overnight low to be producing flat-out by 10:00. Both plants continued to run in this manner until after the peak had abated. |
|
|
|
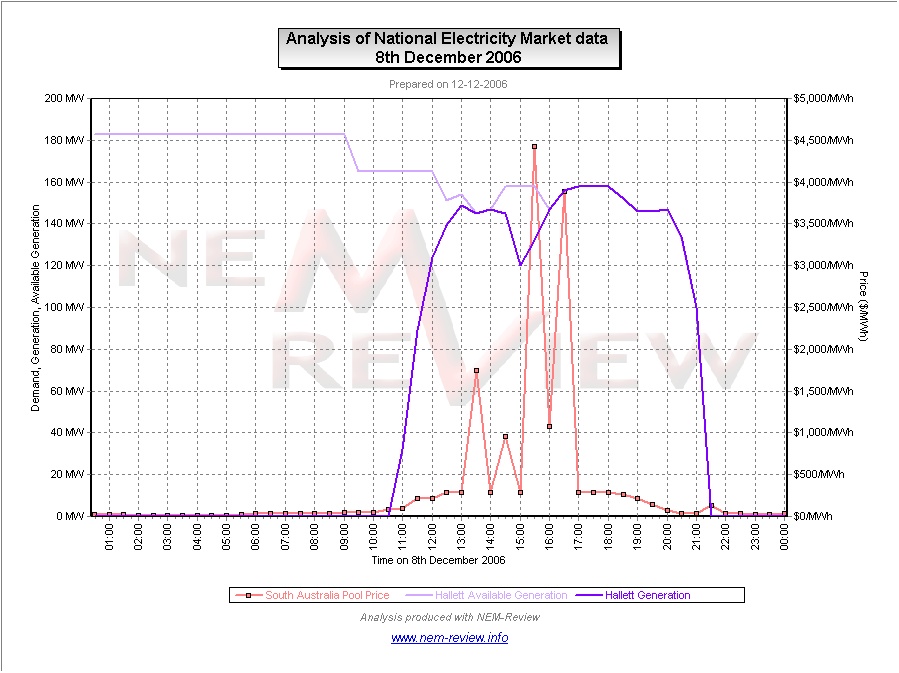
| AGL Energy |
In contrast to Origin Energy, this charts implies that shows that AGL Energy was also playing some role as a price-maker during the afternoon, as the output of the Hallet plant can be seen to drop below declared availability during the afternoon.
From 16:00 all operational Hallet units (it appears as if there were some out of service) were running flat-out until they were all taken off-line in the evening: (note also that the effect of removing 100MW of supply from the market between 21:00 and 21:30 also had a some effect on producing the small blip in prices seen at that time) |
Be the first to comment on "8th December 2006 – high demand in South Australia"