The increasing incidence of negative spot market prices in the NEM, particularly in Queensland in recent days, has made for colourful press reports and opinion pieces along the lines of “new solar generation floods the market, driving electricity prices to zero and below”.
It’s true that the energy production shares of both large and small scale solar PV in Queensland have risen steadily to their current combined level of about 10%, but coal fired generation remains dominant in that state, as well as in NSW and Victoria, accounting for about 80% of electricity produced.
So solar “flooding” the market is a slight overstatement, and just as in other markets, electricity prices reflect how all participating generators in the NEM, not just the new entrants, decide to offer their production, relative to the level of demand. Technically, the spot price is set by the offer of one or more “marginal” generators, but these price-setting offers only become marginal because a sufficiently large volume of energy is offered at lower prices by other generators.
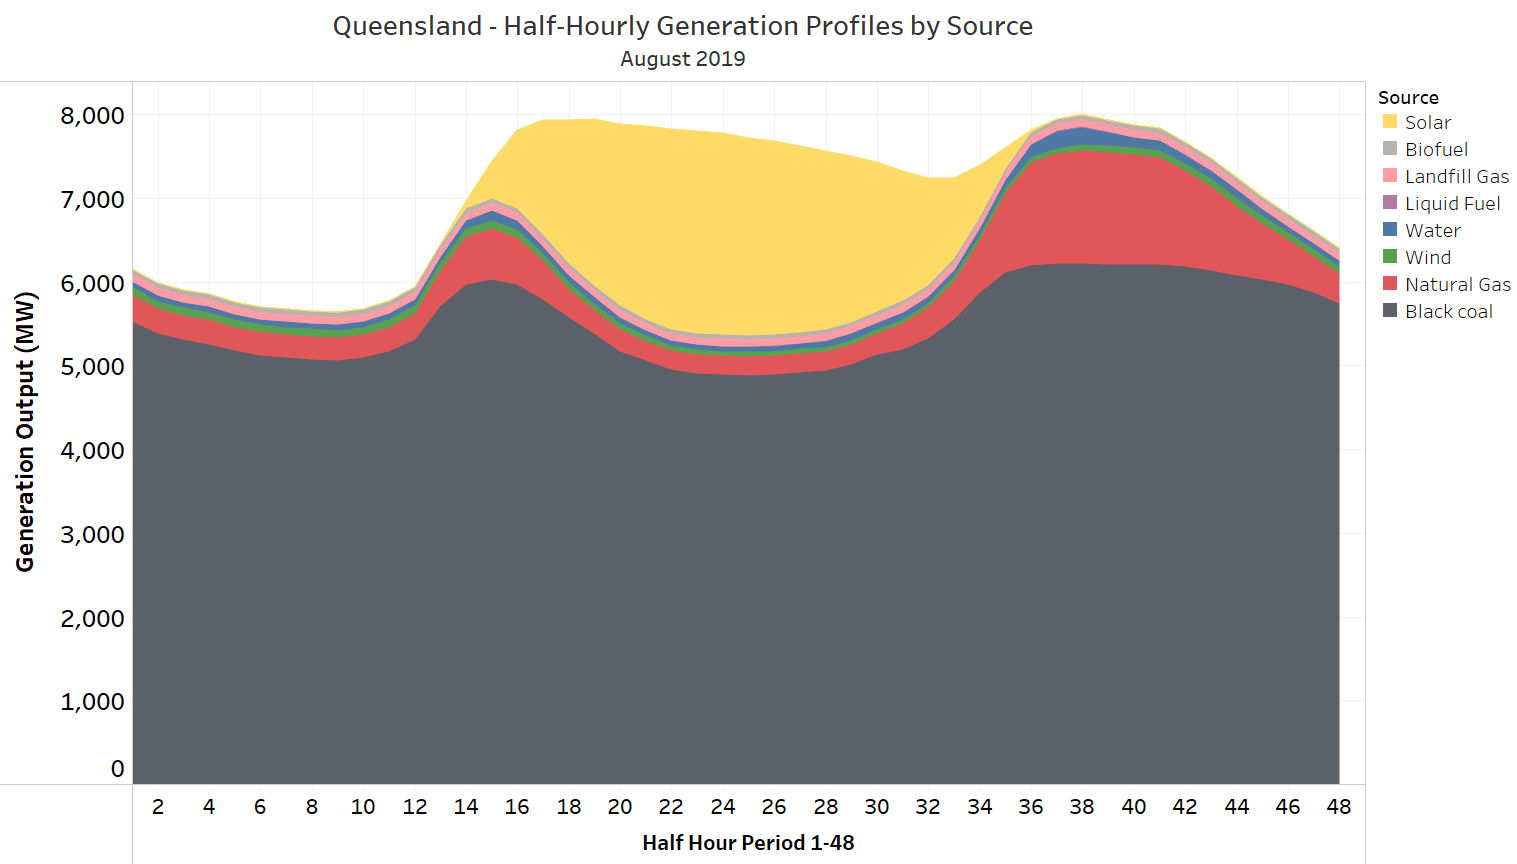
In particular, spot prices only go to zero or negative levels when enough energy is offered at or below those prices to fully satisfy local demand and any net exports. With maximum solar output (including rooftop PV) peaking at around one third of all production in Queensland during the middle of the day (see below), that leaves the bidding behaviour of the dispatchable generators supplying the other two thirds at least as responsible for those zero and negative prices.
For this note I’ve looked at the aggregate bidding behaviour of black coal generators in Queensland in recent weeks, and compared them with their counterparts in NSW. In particular I was interested in analysing how much energy has been offered at zero or negative prices, and how this relates to aggregate “mingen” levels for coal plant – the short-term minimum output levels that thermal generation units can be dialled down to while remaining online. For slow-start units like coal- and gas-fired steam turbine plant, output at mingen can be a significant fraction of capacity, perhaps 30 – 50%.
Minimum output constraints can force such generators to offer mingen volume almost regardless of price, or face going offline, incurring significant cycling costs of unit shutdown and startup. The need to remain dispatched above mingen can thus be an important constraint on the ability of coal-fired generators to “get out of the way” of potential negative prices, which they might otherwise seek to avoid by offering less of their output in negative or zero price bands.
So one obvious hypothesis about negative price incidence is that the “flood of solar” is forcing coal units to dispatch down to their mingen levels. With solar effectively offered to the market as “must run at any price” (not strictly true, but an adequate working assumption for this analysis), are coal generators being forced to bid the price down to zero or lower simply to stay online in the middle of the day?
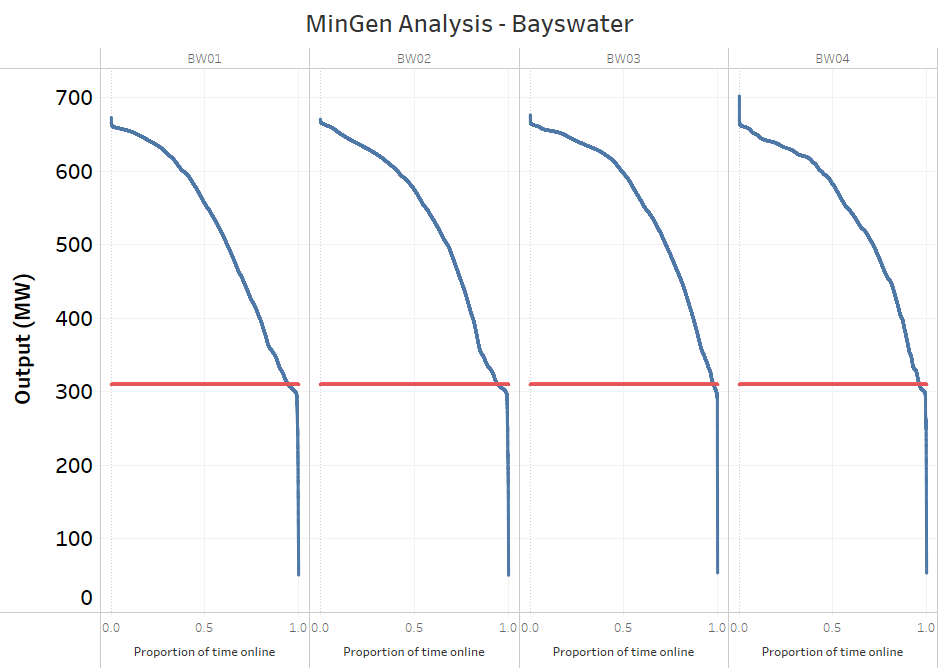
Mingen numbers for the NEM’s coal-fired units are not public data, so I have derived estimates for each coal-fired unit by analysing several years’ data on distribution of unit output when online (example below), and selecting values at around the 90th to 95th time percentile (in many cases the generation duration curve for these units exhibits an obvious inflection point near this range).
As a cross check I consulted AEMO’s ISP planning data, which in all cases gave smaller mingen values, often very significantly lower. Using the higher empirically-derived levels is a conservative assumption, because it will tend to show coal plant being more constrained by mingen than may technically be the case, and less able to avoid negative price outcomes by reducing volume offered at low prices.
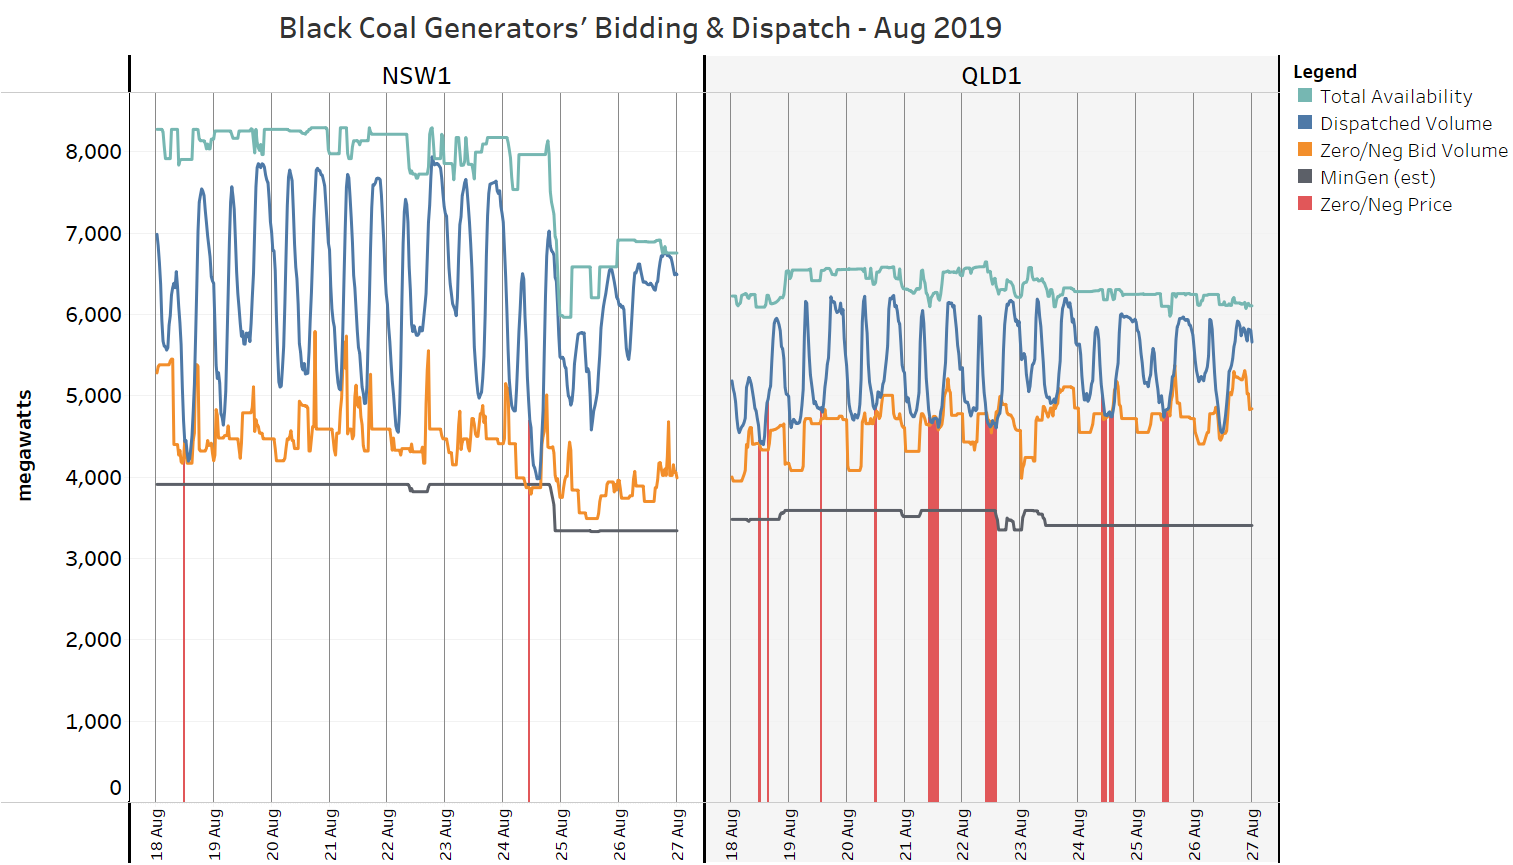
For the Queensland and NSW generators online at any time, I’ve then compared aggregate mingen levels to volumes offered at prices of zero or below, against the output at which they were actually dispatched in the market, and to their maximum available volumes. The results for nine recent days are charted below, also highlighting periods where the half hourly trading price was negative.
Some key observations stand out from this chart:
- Queensland coal-fired generators, as a group, appear to have significantly higher mingen levels as a proportion of capacity than do NSW coal-fired generators. Because the mingen estimates were derived from historic dispatch data, it’s not clear whether this reflects technical or behavioural differences.
- Above these already higher mingen levels (which are likely to exceed true technical minimums), Queensland generators are offering substantially more “discretionary” output at zero or negative prices (the gap between mingen and the “Zero/Neg Bid” lines) than their NSW counterparts.
- The Queensland generators reduce volumes offered at zero/negative prices overnight, but are much less prone to do so in mid-daylight hours where dispatch levels are frequently even lower than overnight, despite the recent incidence of daytime negative prices.
- Queensland coal-fired generators generally operate within a significantly narrower daily output range, in both proportional and absolute terms, than their NSW counterparts. This could be explained in part by the higher fuel costs of NSW coal-fired generation, but also reflects different approaches to bidding strategy.
This analysis is limited in scope and offered more as a thought-starter than as definitive, but it appears that if Queensland’s coal-fired generators wanted to avoid or minimise recurring negative spot prices in the short term, they should be able to achieve this simply by reducing the volumes they themselves offer to the market at very low prices, while still dispatching above technical minimum generation levels. The fact that they have not adjusted their bidding indicates a tolerance for very low daytime prices, counterintuitive as that may seem.
There are very likely to be economic drivers outside the spot market for the bidding behaviour observed here, and this apparent tolerance for very low spot prices. This is because bidding behaviour can be strongly influenced not only by spot market outcomes but also by any contract positions (for both electricity and fuel) that generators may hold. A generator which has sold electricity swap derivatives exceeding its physical dispatch volume has a net financial position similar to a buyer in the spot market, and actually gains as spot prices fall. There could even be strategic considerations behind some generators being prepared to endure very low daytime prices in the short term. Paul McArdle’s recent WattClarity article explores a few of these possible drivers further.
In the longer run, as the proportion of low-cost but variable renewable energy in the system continues to increase, the impacts of mingen levels and other constraints are likely to amplify market price signals and other economic incentives for dispatchable generation and other forms of capacity (storage, demand-side) with greater technical and economic flexibility to replace retiring coal fired generation. The same signals will also reduce the relative returns to other less controllable generation sources like solar PV. This is what markets are designed to do.
——————————————-
About our Guest Author
 |
Allan O’Neil has worked in Australia’s wholesale energy markets since their creation in the mid-1990’s, in trading, risk management, forecasting and analytical roles with major NEM electricity and gas retail and generation companies.
He is now an independent energy markets consultant, working with clients on projects across a spectrum of wholesale, retail, electricity and gas issues. You can view Allan’s LinkedIn profile here. Allan will be sporadically reviewing market events here on WattClarity Allan has also begun providing an on-site educational service covering how spot prices are set in the NEM, and other important aspects of the physical electricity market – further details here. |


Some thoughts:
– what was the proportion of gov owned generators losing money to stay online compared to private companies, because government backed generators with years of huge profits behind them can afford negative prices for longer than most
– a coal fired generator can turn down to the point the boiler air flow can no longer sustain stable combustion, unless it has a turbine bypass, in which case the boiler can keep its firing above the critical threshold and the excess steam can be bypassed straight to the condenser hotwell – a few tonnes of extra coal on top of the negative prices isn’t much
– I’m pretty sure at least one of the QLD coal fired generators is fitted with turbine bypass systems
– to get below the critical coal firing rate requires support from oil or gas burners which are more costly than coal
– what effect does wholesale price volatility have on hedging contracts – I imagine volatility increases risk for both retailers and generators, therefore both of them cover this risk with increased prices to consumers
– what percentage of the QLD demand is supplied through contract
I wonder if some of the actions by the coal plants are aimed at highlighting what is bound to come more often in the future? Not in the realms of conspiracy, but more like, “let’s do this and see what happens, so we may educate ourselves and better prepare for the future”.
Lol if I was into conspiracy theories I would be more interested in the August 2018 islanding of SA and QLD, at almost the exact nadir of SA wind output, which is the only time an event like that could occur with the lowest risk of unintended consequences 🙈.
Stanwell at it again today (Monday 9th September), during the daytime producing well above their night-time generation levels despite negative prices.
There could be a system security issue due to system strength, requiring the big generators to be on line even at low spot price. I am not sure whether there is a market mechanism that force the generators to stay on line regardless of spot prices and then get compensated for the loss. The market operator got caught by the huge influx of asynchronous generators and trying to catch up in their plans.
There is a non-market mechanism for that Nadia – direction by AEMO – and we’ve seen negative price outcomes in South Australia when it is invoked there on days of high wind generation. However AEMO has to publicly notify the market when it directs generation to remain online and that certainly wasn’t the case in these Queensland events. As most of the non-synchronous generation in Qld is embedded small-scale solar I don’t think it would be leading to general system strength issues – although these may emerge in sections of the transmission network with concentrations of utility-scale solar and not much synchronous plant. Allan.