Today’s brief post is more of a question than a post, really. I would really appreciate your thoughts in the comments box below (or offline, if that suits you better).
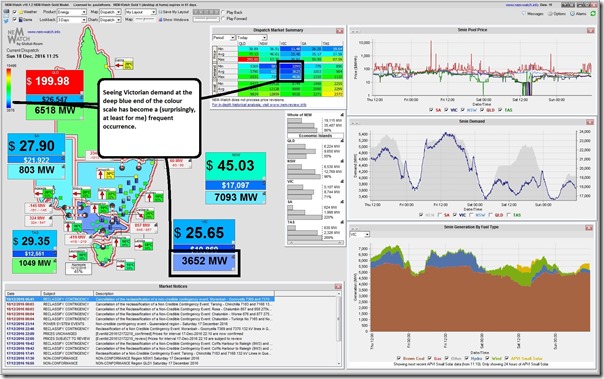
You see I have been watching the NEM unfold through our NEM-Watch dashboard, and other things, and have been frequently seeing Victorian demand down the dark-blue end of the sliding colour scale, even during the day – such as today:
Now, for readers without their own paid licence to the full NEM-Watch application, you can have a look at similar data through the NEM-Watch Consumption Widget, which is located:
1) On the Energy Consumer’s Australia site (our sponsors with this widget);
2) Here, on the NEM-Watch portal – including an explanation of the numbers; and
3) On a number of other sites where people have chosen to embed the widget (no charge). Might be something of interest to you, as well?
Just keep in mind that the full NEM-Watch product focuses on “Scheduled Demand” whereas the Consumption Widget focuses on “Operational Demand” (which is closer to total consumption). The measures are a bit different, but the message is the same – Victorian demand is very low, and has been for some time.
How low, you ask?
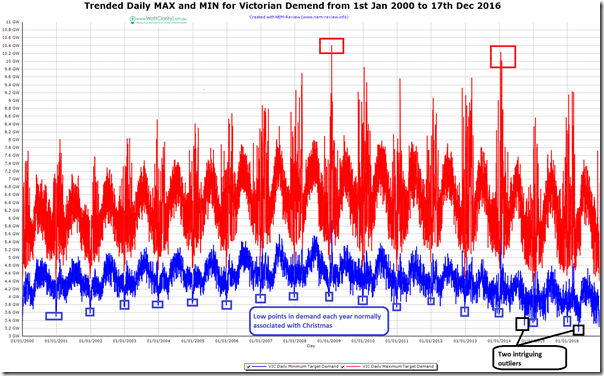
With NEM-Review I have produced the following trend (since January 2010) of daily maximum and minimum demand in Victoria. As you can see, there’s a continuing trend of reduction in minimum daily demand:
We can clearly see the two big peaks in VIC demand, associated with:
1) the Black Saturday bushfire period in summer 2008-2009 – peaking over 10,400MW on 29th January 2009.
2) the heatwave period of summer 2013-14 – peaking over 10,200MW on 16 Jan 2014.
At the other end of the scale, we see that the lowest demand period in the year is typically associated with the Christmas period – when not even the mouse is stirring, etc…
Of particular note on the low side are:
1) the low, low point down below 3,300MW on 28th Sept 2014;
2) an even lower demand level on 1st May this year below 3,200MW; and
3) a consistent bunch of days in the past few months when there have been 10 days with the demand dropping below 3,300MW.
In terms of the most recent lull, we know that:
1) there are problems continuing since the power troubles on 1st December led to damage at the smelter which has made a troubled commercial situation worse (the latest being today’s note of a mercy dash by politicians to Alcoa corporate HQ).
2) Back in 2011, I posted this list of reasons why demand had been declining across the NEM.
3) We also know that, when we are talking about minimum demands, it’ can’t be as a result of solar PV – because minimum demands occur at night time (hence please leave that hobby horse alone in comments below).
4) With respect to the NEM-Watch snapshot above (which is during the day) we see how Melbourne’s weather has been very mild for a December period.
I am interested in real insights you can shed about why minimum demands seem to have ratcheted lower in Victoria (moreso than in SA, NSW, TAS and QLD perhaps) in recent months?
Thank-you, in advance.


I think it might be a mistake to totally discount solar. One of the behaviour changes that will improve the benefit to solar owners is if they can load shift to times when power is available to them from their solar panels; eg rather than overnight water heating instead heat to full capacity in the middle of the day.
The other impacts that are likely to be significant are: –
Shift to LED lighting, including by local councils which must substantially reduce overnight lighting loads,
Greater awareness of parasitic loads and a greater portion of consumers actually turning off devices overnight, and
General improvement in the efficiencies of appliances, fridges and air conditioners
Mick
There was a storm and blackout in Melbourne on the 1st May:
http://www.theage.com.au/victoria/melbourne-weather-wild-storms-lash-city-20160430-goj4ya.html
AND there has been a decided move away from off-peak water heating (less heaters replaced like for like) by a combination of policy makers encouraging gas heaters as less emissions intensive and higher less competitive rates for controlled off peak tariffs. As mentioned by Michael, LED replacements for Street Lighting would be significant. This would also be the case in NSW so not sure if a similar impact would be evident there also?
Re shift to gas HWS we should be able to observe that increase in gas usage so are the figures available?
It surely can’t simply be a coincidence that 28 September 2014 happened to be among the warmest for that time of year (including an all-time September maximum record being set at Avalon Airport). http://www.bom.gov.au/climate/current/month/vic/archive/201409.melbourne.shtml Could this be indicating that some sort of sweet spot is being hit between space heating and cooling demand? Unusual pre-heating of water going into electric-powered hot water systems may also be a contributor?
Interestingly, in a research report published by Morgan Stanley yesterday and titled “Inside Industrials: Electricity: Demand -1% but Supply -23% (03 Jan 2017)”, the following passage was included:
Will help to provide some context to the above.
There was an article that briefly appeared on The Age website that the Wonthaggi desalination plant had not yet produced any of the water that had been ordered back in March 2016. The order was for 50 GL of a 150 GL capacity, to be delivered by June 2017. The website of the plant’s owner, Aquasure, still shows that no water has been produced. One would think that in order to minimise power costs, the plant would be run at 100% capacity for 33% of the time between July 2016 and June 2017, utilising the half-hour periods with the expected lowest third of power prices. According the The Age article, there has been a commissioning problem with the underground cable from the Cranbourne Terminal Station (perhaps akin to the problems with Basslink). At full capacity, the plant uses 90 MW, so we can expect a boost to Victorian power prices when they finally resolve these problems.
The desalination plant is part-owned by Engie, who also part-own Hazelwood. It would surely be in their interests for the plant to be operating before Hazelwood shuts, firstly to obtain a lower power price for the desalination plant, and secondly to boost to the price of power sold by Hazelwood.
The 50 GL of desalinated water come at a high cost, whereas about over 80 GL of water flowed down the Yarra River past the pumping station for the Sugarloaf Reservoir in September and October 2016, because there hadn’t been sufficient investment in capacity to pump this water to other reservoirs.