In the recent updated look at Bulgana Wind Farm we presented a trend of six metrics that reveal aspects of a unit’s availability to generate.
Here, we sum across units, grouping by resource type, to present NEM-level aggregates.
The two resource types are Wind and Solar.
Wind
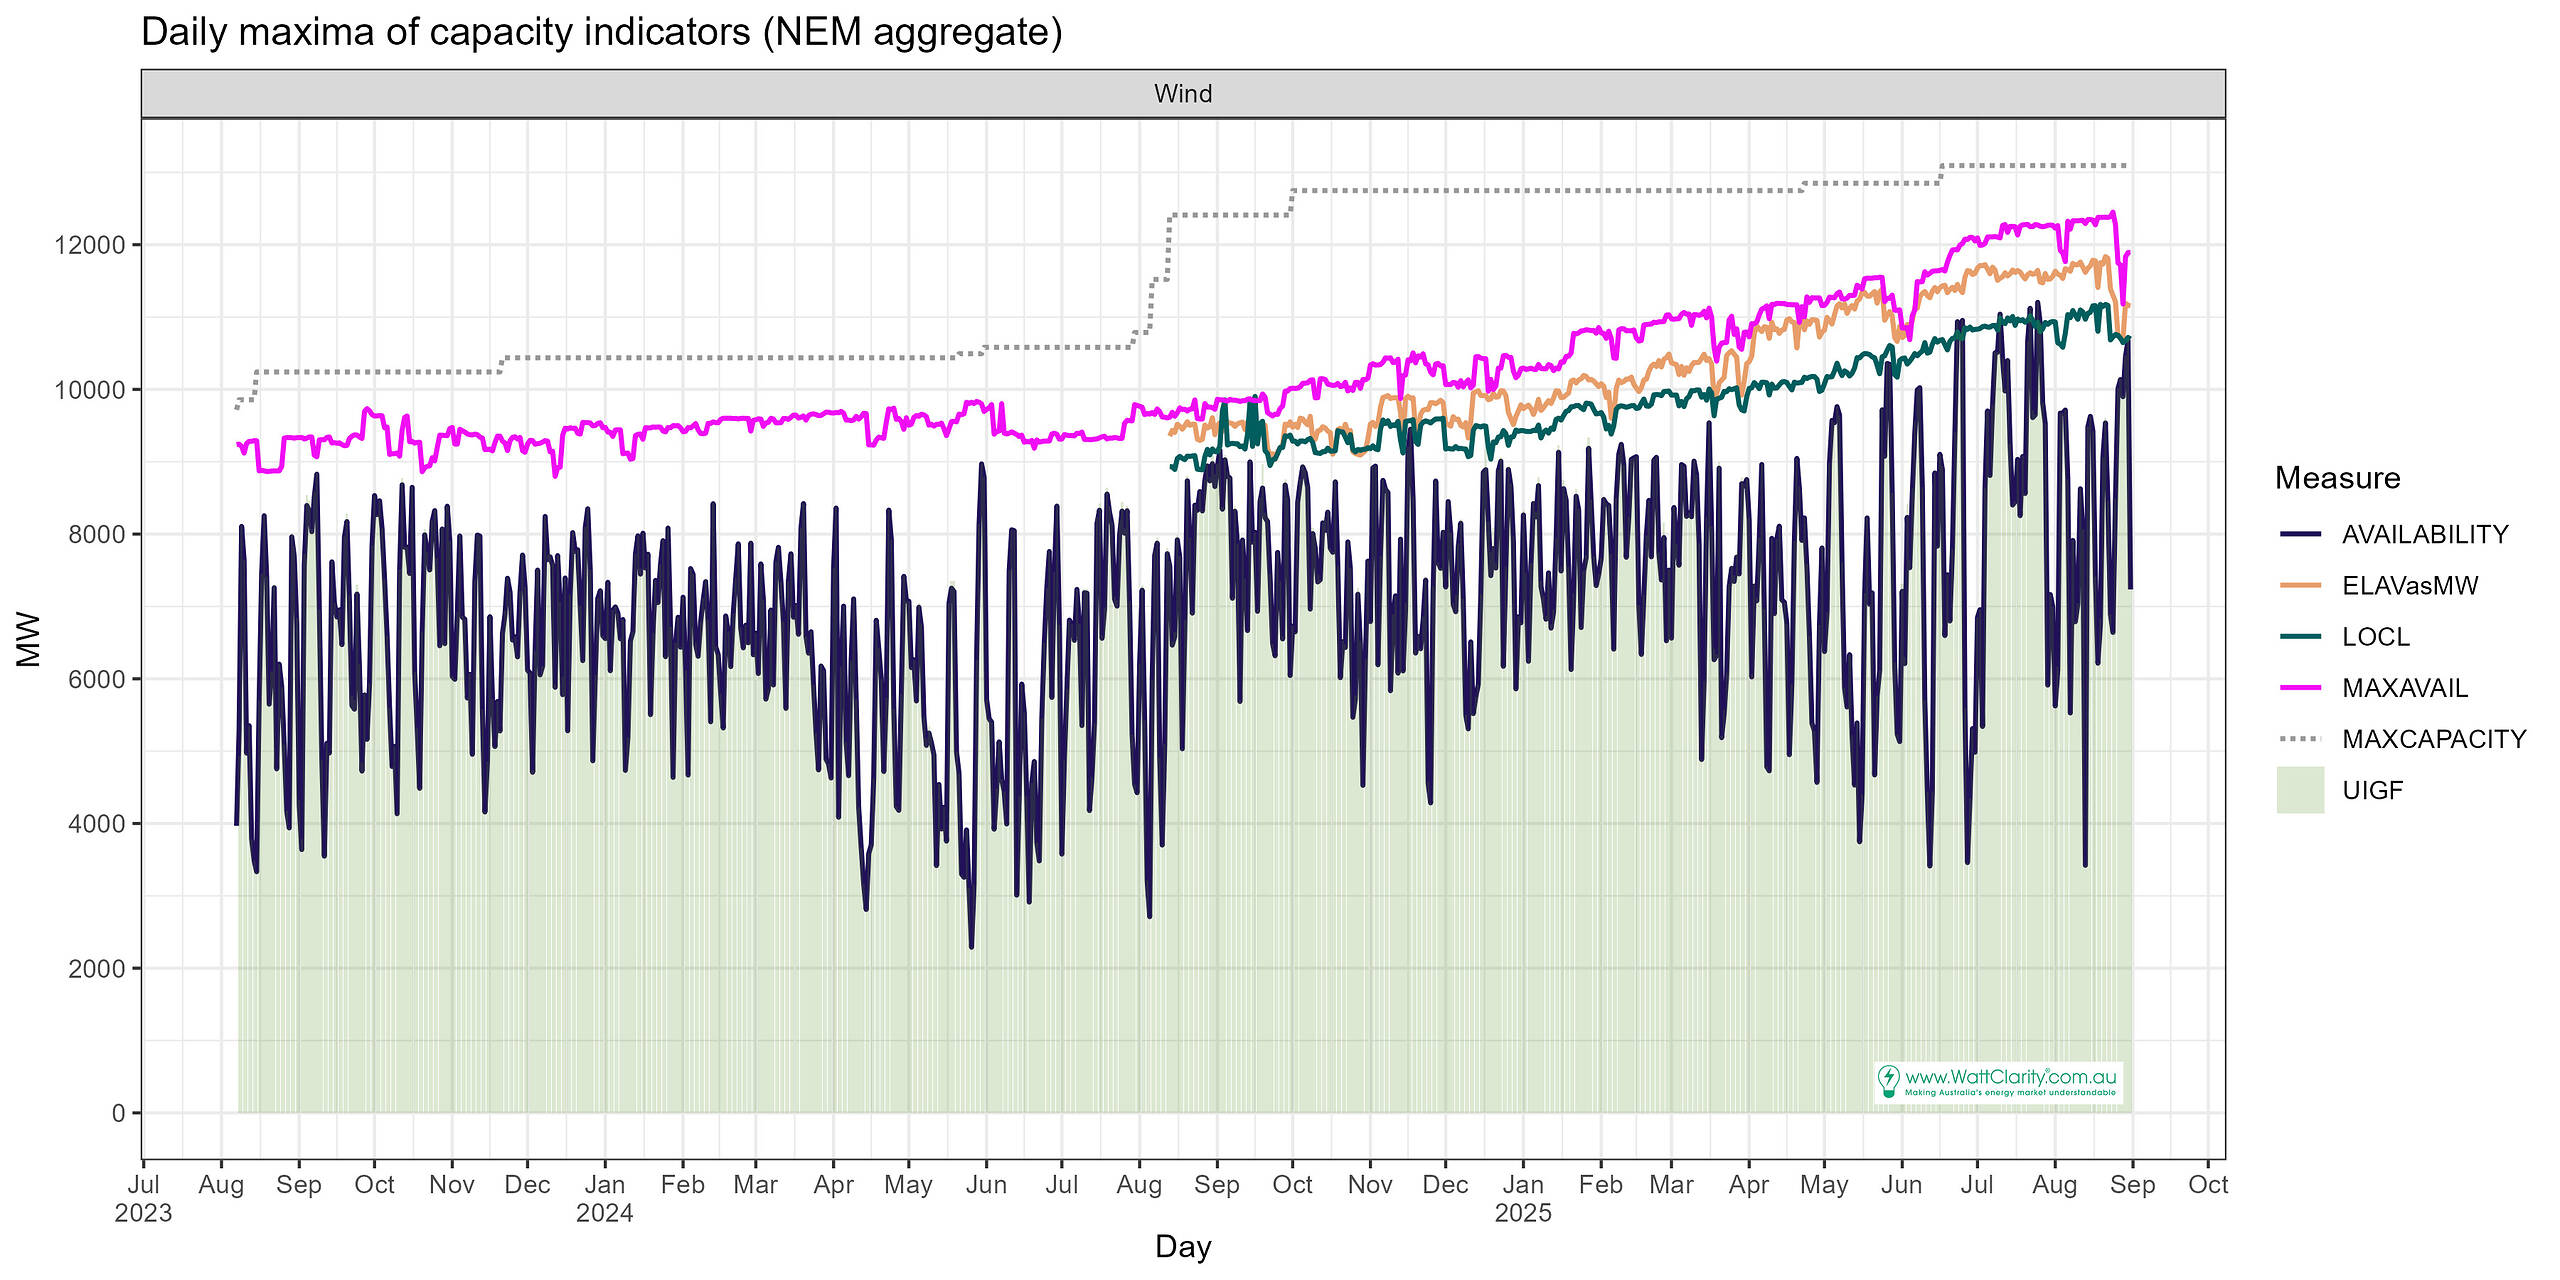
Here is the chart. Observations are below.
Observations from the chart for Wind:
- Max Capacity
- This reflects the maximum over time. It isn’t adjusted down for commissioning periods. That’s why it is fairly flat most of the time, and steps up when each new unit appears in dispatch or the value changes in the registration data.
- Max Availability
- The MAXAVAIL value, as-bid.
- This is the parameter that, since August 2023, acts as a cap on dispatch availability. Generally, it reflects commercial intentions.
- This trend takes the same upward trajectory as Max Capacity but without the step-changes.
- Generally, can be interpreted to reflect commercial intentions but also may be used during commissioning and hold-point testing.
- Its natural position appears to be about 10% lower than max capacity. This gap widens as new units undergo commissioning.
- Elements available as MW (converted to a MW value using element sizes ‘ELAVasMW’)
- Estimated turbine-level availability.
- Tends to sit between max capacity and the local limit (LOCL).
- Appears to track in line with max capacity.
- Local limit (LOCL)
- “The lower of the farm’s plant availability and all technical limits on the capacity of its connection assets to export energy”.
- The local limit appears to be, nowadays, sitting about 7-8% lower than the estimated turbine level availability (ELAVasMW).
- Availability (and UIGF)
- The availability used in dispatch reflects is the minimum of the MaxAvail and UIGF for a unit.
- Availability reflects the UIGF, for the most part.
- We see we see the Local Limit lower than Availability in June and July 2023 for a couple of days. This is attributed to zeroes for the local limit, appearing to be associated with data quality issues, and those zeroes not reflected in the UIGF that feeds into Availability.
- The variability in this Aggregate Availability will be of note to some.
- The upper reaches of Availability have risen.
- The lower reaches continued to drop below 4,000 MW in 2025 – even though 3,000MW of Max capacity has been added.
Solar
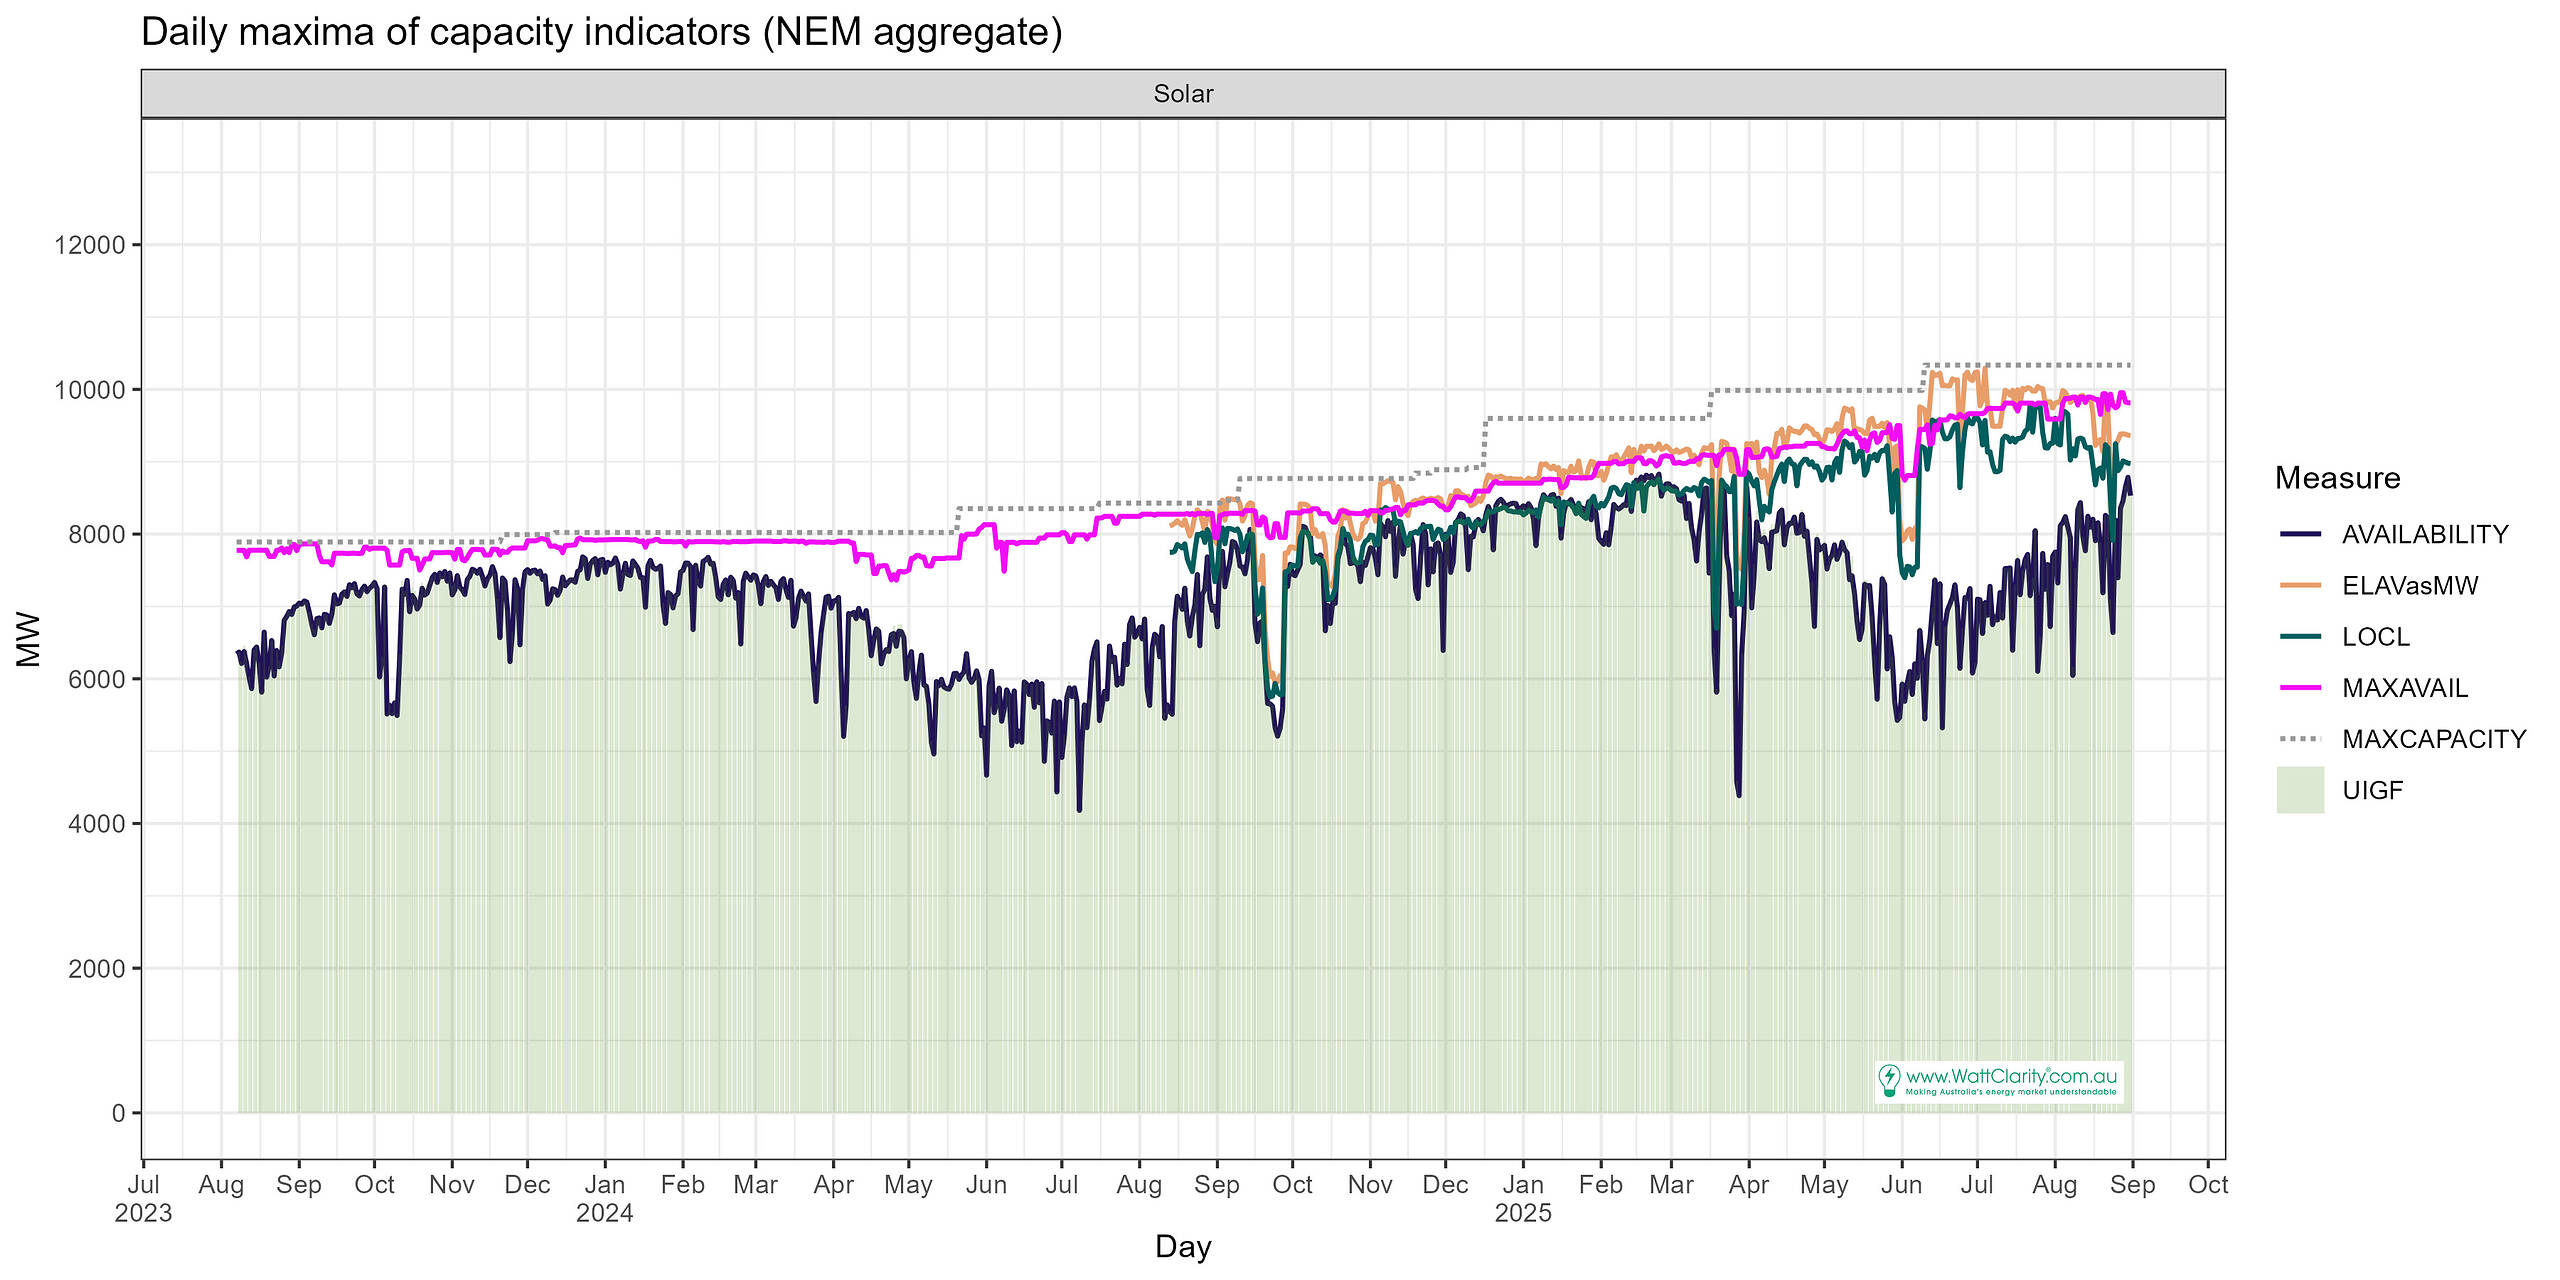
Solar is charted with the same MW axis as Wind. We can see that its Max Capacity is lower than Wind. Further observations follow.
Observations from the chart for Solar:
- Seasonality
- In the overall trend of the Availability series.
- Lower in winter and near Max Availability in summer.
- Max Availability and Max Capacity
- Generally very close owing to fact that most sites are inverter-limited so output at Max Capacity is usually achievable on a sunny summer day even with some plant de-ratings.
- In recent months we are observing a divergence between Max Capacity and Max Availability.
- But that may involve new unit commissioning activities and commercial use of the Max Availability parameter.
- Elements Available as MW tracks slightly higher than the local limit, and may well be for the same reasons as Wind.
- A large dip in most metrics is evident at the start of June 2025. Yet the dip in September 2024 appears greater in magnitude at roughly 2,000 MW.
- In the overall trend of the Availability series.
Anomalous days
The following table draws out some anomalous periods from the charts above to relate the day(s) to market events where identifiable or elsewhere reported on Watt Clarity.
Day
| Period | Solar Notes |
| 21 – 27 September 2024 | The constraint sets for an outage on the Jindera to Wagga line (N-JNWG_RADIAL) and Darlington Point to Wagga (N-DPWG_63) imposed 0 MW and 0 inverter limits on many Solar units for the duration of the outage. |
| 31 May – 7 June 2025 | The constraint sets for an outage on the Wagga to Walla Walla line (N-WGWA_63_X5) were primarily responsible imposing 0 MW and 0 inverter limits on many Solar units for the duration of the outage. |
| 17 June 2025 | The largest gap between Availability and Local Limit is seen. A rain and cloud-affected Queensland drastically impacted UIGFs and Availability on this day. |
| Period | Wind Notes |
| 28 May – 4 June 2025 | Max Availability declined over successive days, led by a similar decline from the Elements Available, but not reflected in the Local Limit. Clark Creek had a rebid “Internal outages limiting to 38 TWGs” on the 2nd, Blugana had an “unplanned outage”, Ararat Wind Farm had planned works, and a number of other wind farms had reduced availability over this period. |
| 26 May 2024 | The lowest Availability day, where low wind yield continued after sunset. |
| 13 August 2025 | The largest gap between Availability and Local Limit is seen, exceeding 7,500MW. Light wind conditions in all NEM regions outside of QLD were experienced. |
Reflections
Temporary changes in Local Limit and Elements available may be imposed on units due to network outages: constraints!
Weather patterns impacting large portions of the Queensland east coast can lead to considerable decreases in solar resource and resultant Availability.


Leave a comment