As belatedly recorded it here now:
- On Wednesday night 28th May 2025, there was a turbine fire at Bulgana Wind Farm:
- That destroyed a blade on a wind turbine
- And led to operational changes from that point.
- This was first reported by RenewEconomy on Friday 30th May 2025
- that’s how we found out.
About 2.5 months later, in experimenting with the ELAV data, Linton posted about ‘Turbine availability at Bulgana wind farm’ on 13th August 2025 to explore what had happened since that time.
An updated and extended graphical view
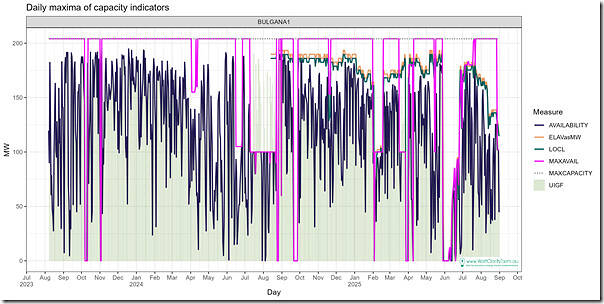
We’ve continue to explore that data set (and others) with a view to understanding better the trended physical/technical availability of Semi-Scheduled units (as distinct from the energy-limited UIGF). So here’s a updated and extended chart for Bulgana Wind Farm that Linton’s put together for me:
There’s a lot going on in this trend (and we’ll look to make the representations progressively clearer over time), but worth calling out a few in this table:
| Metric | Description of Metric |
|---|---|
Maximum Capacity |
This metric from the MMS is (more often than not*) the ‘best’ metric to use to represent the Installed Capacity of the particular unit. The reason we hedge a little here was explored in the article ‘Analytical Challenge – choosing what measure to use, for ‘Installed Capacity’’, published 3 years ago now. |
MaxAvail |
The ‘MaxAvail’ is a property set for a unit (Scheduled or Semi-Scheduled ) via its Daily Bid, and can be updated up to gate Closure #2 via its rebid. The case for fully Scheduled units is quite simple – but for Semi-Scheduled units there is an added complexity to be aware of: 1) Prior to 7th August 2023 … the MaxAvail in the bid was completely ignored. 2) From the 13:40 dispatch interval on Monday 7th August 2023 forwards (a) As collated in this series of articles, AEMO changed its pre-processing processes feeding into NEMDE such that MaxAvail is now also taken into account (b) Of particular interest might be the article ‘How many Semi-Scheduled units have taken advantage of the market change that went live on 7th Aug 2023?’ published in March 2024 following collation of ~5 months of initial history for the GSD2023. (c) Readers should note that ~25 months have now elapsed since that change … as we can see in the pink data series in the chart above. |
Elements Available (ELAV) |
Since the establishment of the Semi-Scheduled category, participants have been enabled (encouraged!) to submit metrics to AEMO via their SCADA system that AEMO (via AWEFS or ASEFS) could factor into their derivation of the UIGF for the unit. 1) Two of these data sets have been Elements Available (ELAV) and Local Limit (LOCL) 2) One limitation of this process was that, until August 2024 these data sets were never published to the broader market (a) as noted here on 14th August 2024, ‘AEMO commences publishing actual intermittent generators (SCADA) availability data to the EMMS Data Model’ the AEMO began publishing this data 13 months ago now. (b) Hence we can see both appear in the chart above from August 2024 … but readers should not forget that these metrics existed (and were used as inputs to NEMDE) beforehand, the market just had no visibility! 3) Worth noting (what some see as) another ongoing limitation in that these metrics are supplied via the SCADA system: (a) Not via the rebid process; (b) Hence changes not accompanied by any rebid reasons or the like. |
Local Limit (LOCL)
|
|
UIGF |
The acronym ‘UIGF’ stands for Unconstrained Intermittent Generation Forecast, and is utilised for all Semi-Scheduled units: 1) Building on the ‘technical availability’ numbers noted above; 2) But also then factoring in the wind or solar resource that is estimated to be available … in this case for each dispatch interval.
|
Availabilityi.e. as used within NEMDE for dispatch |
All of the above numbers are referenced in the (increasingly complex) process that AEMO uses to define the ‘Availability’ for the unit for a given dispatch interval. As a very useful (and often referred to) reference to the complexity in this process, in August 2023 Linton wrote the ‘What inputs and processes determine a semi-scheduled unit’s availability’ article. |
A chronological history
From the graphical trend above (and with reference to Linton’s prior article, and some other external references) we have compiled the following updated and extended chronological history – this time not in reverse-chronological order:
| Timing | Development at this time |
|---|---|
29th Dec 2021Full commercial operations |
We saw that Neoen announced ‘Neoen’s Bulgana Green Power Hub begins full-scale commercial operation in Victoria, Australia’. |
7th August 2023MaxAvail commences |
This is when our data series begins, following the commencement of the AEMO process to consider MaxAvail in the context of the inputs to NEMDE. |
October 2023 |
An full outage lasting ~5 days during which MaxAvail was set to 0MW: 1) 7th October 2023 to 11th October 2023 2) For reasons not explored (perhaps visible in the bid?) |
November 2023 |
An full outage lasting ~2 days during which MaxAvail was set to 0MW: 1) 2nd and 3rd November 2023 2) For reasons not explored (perhaps visible in the bid?) |
April 2024 |
An partial outage in 2 spurts during which MaxAvail was reduced: 1) 3rd April to 9th April 2024 with MaxAvail at 155MW, then up to 160MW … before back up to 204MW on the 10th April 2) 11th and 12th April 2024 with MaxAvail at 160MW 3) For reasons not explored (perhaps visible in the bid?) |
June 2024 |
An partial outage during which MaxAvail was reduced: 1) 16th to 26th June 2024 with MaxAvail reduced from 204MW to 105MW 2) For reasons not explored (perhaps visible in the bid?) |
July-August 2024Something |
An long partial outage during which MaxAvail was reduced: 1) From 10th July to 28th August 2024, with MaxAvail mostly reduced from 204MW to 100MW (some days 90MW). 2) For reasons not explored (perhaps visible in the bid?) 3) Note that, during this period, we start to see ELAV and LOCL being published. There was then a 3-day full outage: 1) For 24th, 25th, 26th August 2024, 2) During which all measures (MaxAvail, ELAV and LOCL) were all zero. 3) For reasons not explored: (a) perhaps visible in the bid for MaxAvail? (b) No visibility possible for ELAV and LOCL
|
September 2024 |
There was a 7-day full outage: 1) For 21st to 27th September 2024, 2) During which all measures (MaxAvail, ELAV and LOCL) were all zero. 3) For reasons not explored: (a) perhaps visible in the bid for MaxAvail? (b) No visibility possible for ELAV and LOCL |
November 2024 |
There was then a 3-day partial outage: 1) For 19th, 20th and 21st November 2024, 2) During which all measures (MaxAvail, ELAV and LOCL) were all reduced. 3) For reasons not explored: (a) perhaps visible in the bid for MaxAvail? (b) No visibility possible for ELAV and LOCL
|
February 2025 |
There was a 17-day (mostly just) partial outage: 1) From 1st February 2025 to 17th February 2025 2) During which all measures (MaxAvail, ELAV and LOCL) were all reduced … Though noting that ELAV and LOCL actually started reducing on 28th January 2025 3) For reasons not explored: (a) perhaps visible in the bid for MaxAvail? (b) No visibility possible for ELAV and LOCL |
March-April 2025 |
There was a 24-day (mostly just) partial outage: 1) From 17th March 2025 to 9th April 2025 2) During which: (a) MaxAvail was reduced (or zero) the whole period (b) Whilst LOCL and ELAV were reduced for less time 3) For reasons not explored: (a) perhaps visible in the bid for MaxAvail? (b) No visibility possible for ELAV and LOCL |
since the fire on 28th May 2025 |
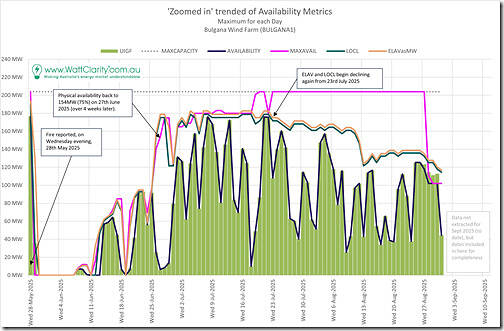
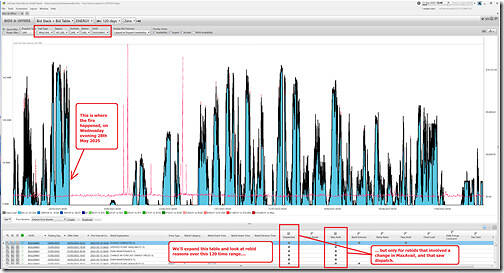
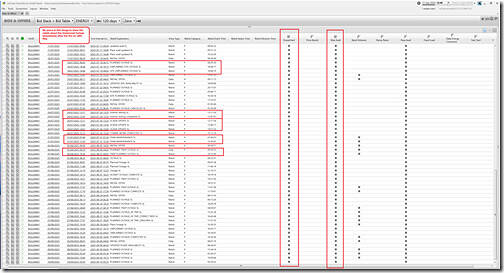
We saw that ‘RenewEconomy noted (on 30th May 2025) the turbine fire at Bulgana Wind Farm’, with the fire occurring on 28th May 2025. So, in this part of the table, we thought we would have more of a focused look at what has happened since: Click the image to open a larger resolution in a separate tab With respect to this zoomed-in view, we see 1) Following the fire, the station (all turbines) was offline for a ~2 week period before progressively bringing turbines back; 2) A little over 4 weeks after the fire (27th June 2025) availability (set at the lower limit by MaxAvail) was at 154MW (or ~75% availability); 3) Since that time the highest point reached was 183MW on 4th July 2025 (capped by LOCL); 4) From that point to 22nd July the availability oscillated slightly from that time 5) But from 23rd July 2025 through until the end of August 2025 (almost 6 weeks) the availability progressively declined (a) down to 102MW (availability ~50%) at the end of August, capped by MaxAvail (b) with the decline due to reasons unexplored and unknown 6) Data has not been extracted for 11 days in September (to date) so we can’t comment on what’s happened since that time. Curious to explore a little further, we opened up the ‘Bids & Offers’ widget and filtered down to just the BULGANA1 unit and set the time-range to look back 120 days. What follows are two images from the same widget – the first with the Chart shown across most of the screen (to highlight that the trend starts on 14th May 2025, so ~2 weeks prior to the fire: Expanding the ‘Bid Table’ over this time-range, we see that the table (even if filtered down to just show bids encompassing some change in MaxAvail and that it saw dispatch) still contains too many entries to appear on a screen without scrolling. Here’s a maximum view: I’ve highlighted some of the rebid reasons to point of some of the diversity of reasons: 1) Some planned, some unplanned 2) Some where particular pieces of equipment are highlighted (I, for one, don’t know what a ‘DVAR’ is) 3) Some periods of reduced availability due to an outage in the Ausnet transmission/distribution network.
|
July-August 2025related to the sale process |
Separate from the above, we saw the following related to the sale of Bulgana Wind Farm: 1) On 1st July 2025: (a) this ASC Release by HMC Capital reported that the financial close to the acquisition of Neoen’s Victorian assets would be a month later than originally agreed. (b) The statement included reference to impacts of the fire that happened in May: “On 28 May a fire incident impacted 1 of the 56 wind turbines at the Bulgana Wind Farm which has resulted in a detailed operational and safety review. Following the safety review, 49 of 56 wind turbines (~90%) are operating, with all apart from the fire impacted turbine expected to be operational in the coming weeks. With the wind farm expected to return to full operation prior to financial close, there is not expected to be any material impact on forecast cashflows or returns from the asset.” 2) On 4th August 2025: (a) HMC Capital announced the financial close of the acquisition of Neoen Australia’s Victorian assets which includes Bulgana Wind Farm. The announcement was made in an ASX statement. (b) The statement included reference to impacts of the fire that happened in May: “At financial close, 51 of 56 wind turbines at the Bulgana Wind Farm were operational, with the majority of the remaining turbines scheduled to be returned to service within the next two months” 3) This was noted in various places, including: (a) by RenewEconomy via the article ‘Return of fire-hit Bulgana turbines delayed as HMC completes Neoen asset deal, seeks new investor’. (b) On 5th August, via WattClarity we included a recap of media attention covering the acquisition in ‘Catching up, after ~5 weeks away … what (else) did I miss?’. (c) Probably elsewhere, but we have not collated here |
Might add more words here?
Some concluding (at least for now) observations
Briefly, worth finishing off with some things that stand out at me here …
1) All of this should not be read as singling out any particular Wind Farm:
(a) But rather trying to draw observations about the whole
(b) including the types of data now accessible (and data still not accessible).
2) Not for one day in the entire 25 month period does the Availability of the unit reach the Maximum Capacity of the unit.
(a) The highest point it reaches is 195MW of 204MW MaxCap.
(b) So peak availability of 96%.
3) Whilst a casual reader (or more distant observer of the NEM and the energy transition) might conclude that this has been due to the lower wind resource…
(a) The trend of ELAV and LOCL (that’s only visible since August 2024) provides some clues as to why that might have been the case.
(b) So we conclude from this that physical plant availability is something important to know for VRE units (not just for older coal units!)


Great article. Brings some balance to the discussion. Too many are focused on the output of “aging and unreliable” coal generation and ignoring the limitations and transparency around VRE output… which is absolutely necessary when navigating the impact of extended wind droughts.