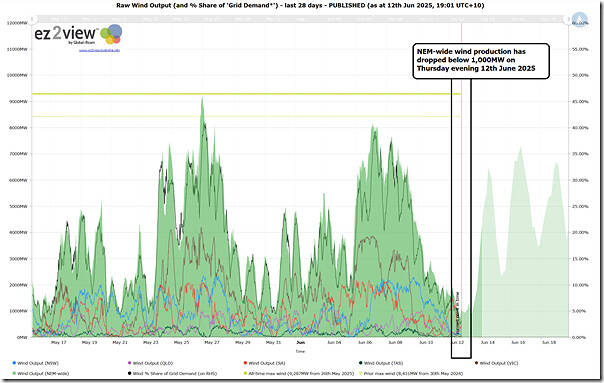
One other snippet of information to share this evening (Thursday 12th June 2025) comes from a snapshot of this live-updating dashboard style view of NEM-wide wind harvest (powered by ez2view):
As noted here, NEM-wide wind yield has dropped below 1,000MW this evening (so lower than appeared the case yesterday evening).
1) lowest point thus far is 721MW (FinalMW for 16:20 NEM time), right across the NEM
2) that’s from ~14,000MW of installed capacity.
3) so an instantaneous capacity factor of ~5%.
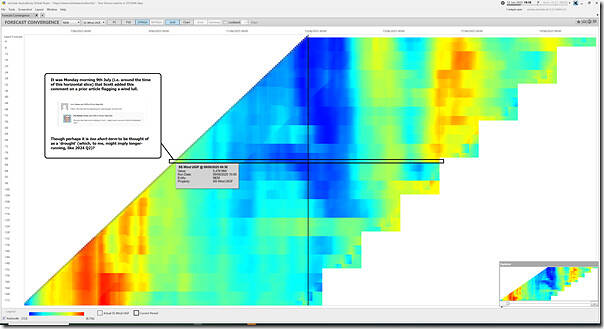
Which makes me think about the question posed here on Monday morning by Scott. Reaching for the ‘Forecast Convergence’ widget in ez2view we see the following heat map of successive AEMO forecasts for NEM-wide wind UIGF looking back ~7 days and forward ~7 days:
With respect to this image:
1) Remember that this widget allows one to ‘look up a vertical’ in order to ‘see that other dimension of time’
2) I’ve indicated in a horizontal stripe the period of time that Scott made his comment, looking forwards to the right.
3) So we see that the wind forecast has deepened in colour (i.e. forecast lower UIGF) since that time, with the depths persisting into Friday afternoon/evening 13th June 2025 before trending back upwards.
… so keep an eye on tomorrow, as well.


Leave a comment